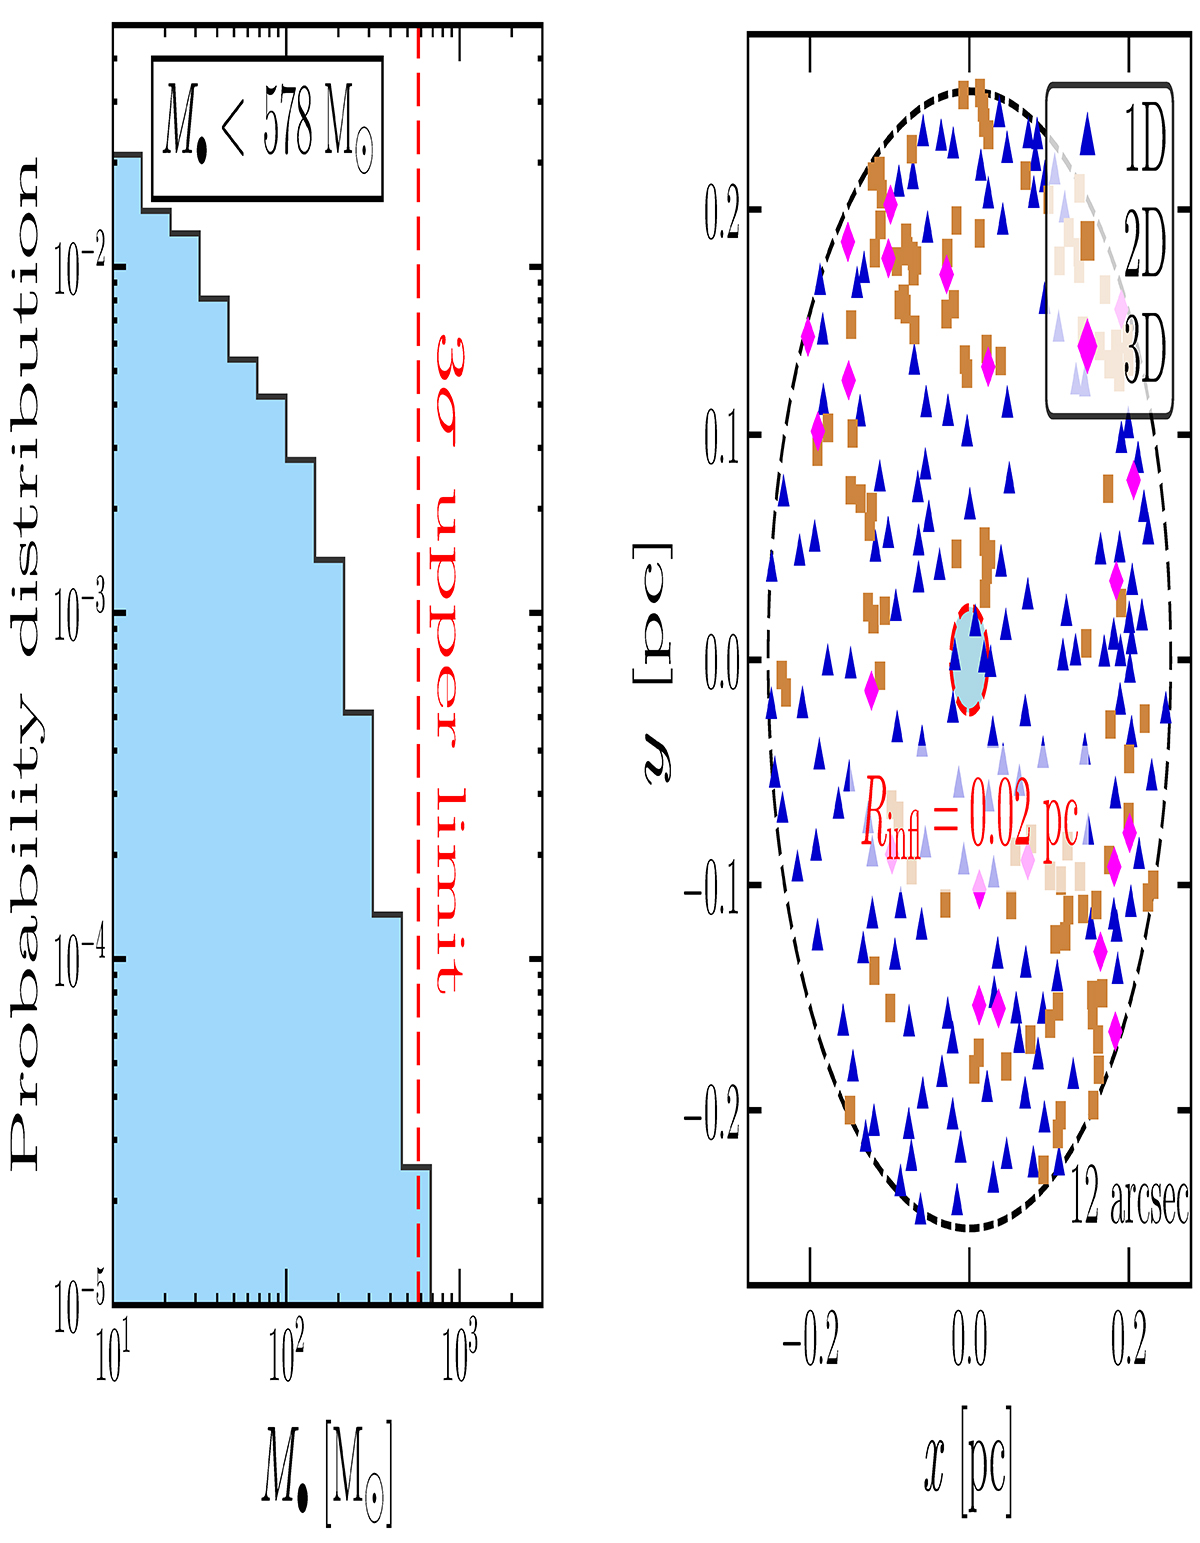
Fig. 1.
Download original image
Posterior distributions on the IMBH mass and region of influence in 47 Tucanae. Left: posterior distribution on the BH mass (blue histogram). The vertical line indicates the upper limit on the BH mass (578 M⊙) containing 99.7% (3σ) of the posterior distribution. Right: spatial distribution of the kinematic sample of individual stars inside a circumference of radius of 12″ (black curve). Each star is color-coded according to the available kinematic information: LOS velocity (i.e., 1D velocity) in dark blue, proper motion (2D) in brown, and full kinematic information (proper motion and LOS velocity, i.e., 3D) in magenta. The blue shaded area indicates the region that would be influenced by a central BH with mass 578 M⊙ (our 3σ upper limit), which has a radius of influence Rinfl = 0.02 pc (red curve).
Current usage metrics show cumulative count of Article Views (full-text article views including HTML views, PDF and ePub downloads, according to the available data) and Abstracts Views on Vision4Press platform.
Data correspond to usage on the plateform after 2015. The current usage metrics is available 48-96 hours after online publication and is updated daily on week days.
Initial download of the metrics may take a while.