Fig. 5.
Download original image
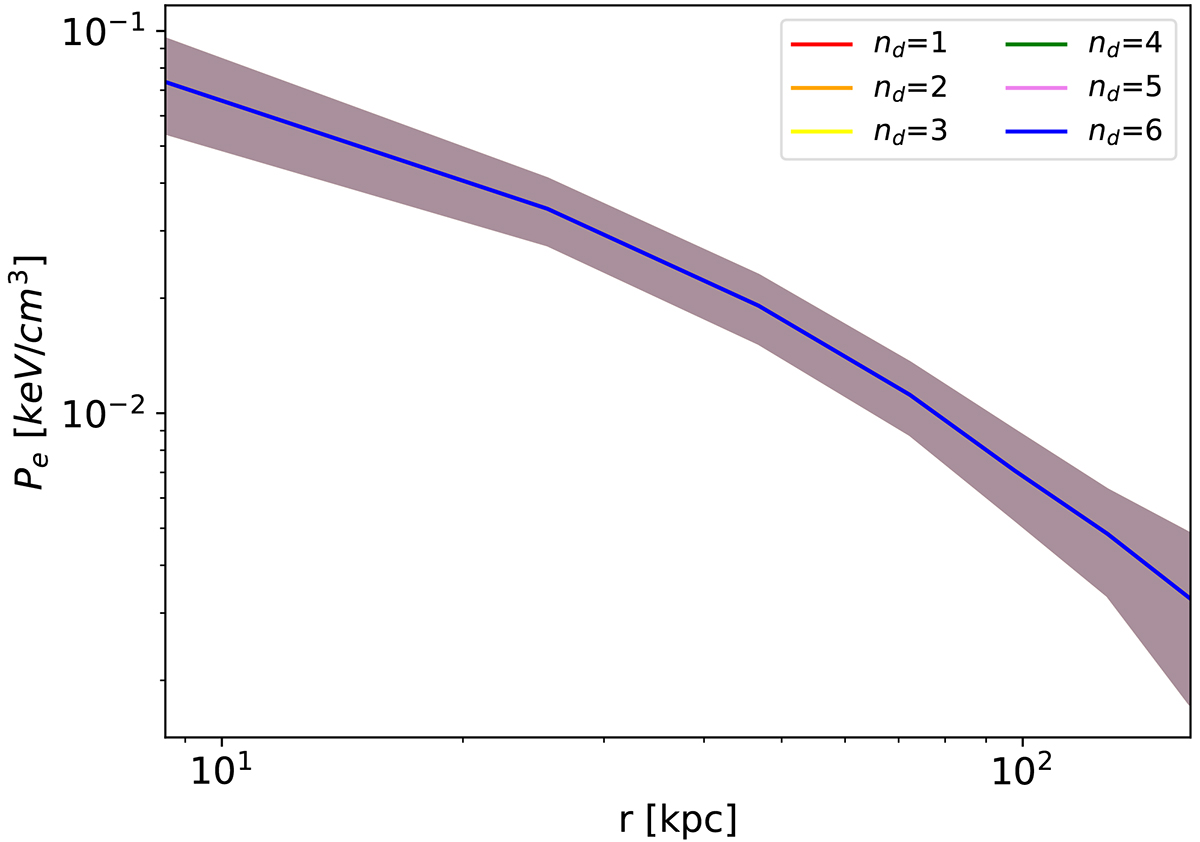
Best-fit pressure profile obtained from SZ signal by marginalizing over the different gNFW models using a BMA technique. The solid lines denotes the median pressure profile, while the shaded regions mark the 68% credible interval on the posterior BMA model. We use different colors for different nd, but we can see the pressure profile is not affected by this parametrization.
Current usage metrics show cumulative count of Article Views (full-text article views including HTML views, PDF and ePub downloads, according to the available data) and Abstracts Views on Vision4Press platform.
Data correspond to usage on the plateform after 2015. The current usage metrics is available 48-96 hours after online publication and is updated daily on week days.
Initial download of the metrics may take a while.