Fig. 4.
Download original image
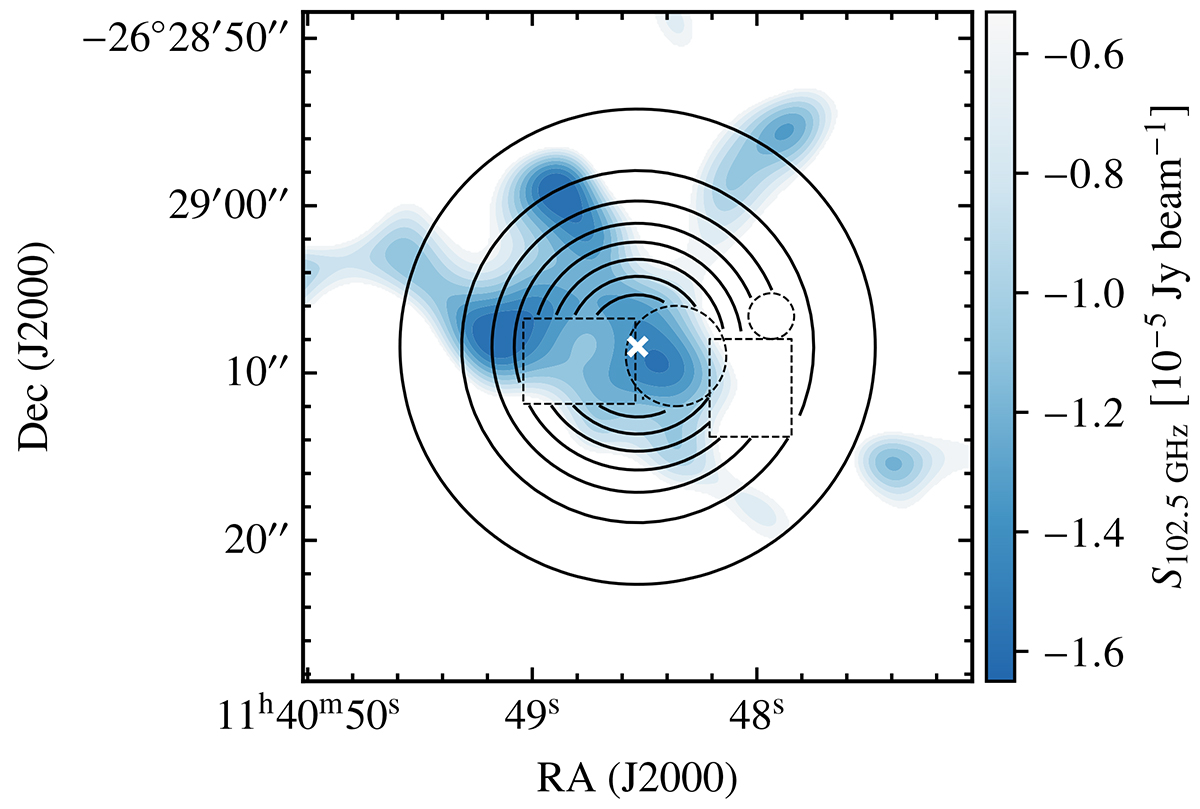
Adapted from Di Mascolo et al. (2023): Contours from the SZ surface brightness map from a combined ALMA+ACA image (blue). The contours are set arbitrarily to optimally emphasise the bulk SZ signal. The black solid contours represent the model obtained with the single two-dimensional β-model fitting on Chandra AGN-subtracted X-ray image in the soft band, while the dotted circles and dotted squares represent the regions excluded in the analysis, namely, the eastern and western jets, central AGN, and an unresolved source. The white cross represents the X-ray emission centroid.
Current usage metrics show cumulative count of Article Views (full-text article views including HTML views, PDF and ePub downloads, according to the available data) and Abstracts Views on Vision4Press platform.
Data correspond to usage on the plateform after 2015. The current usage metrics is available 48-96 hours after online publication and is updated daily on week days.
Initial download of the metrics may take a while.