Open Access
Fig. A.1
Download original image
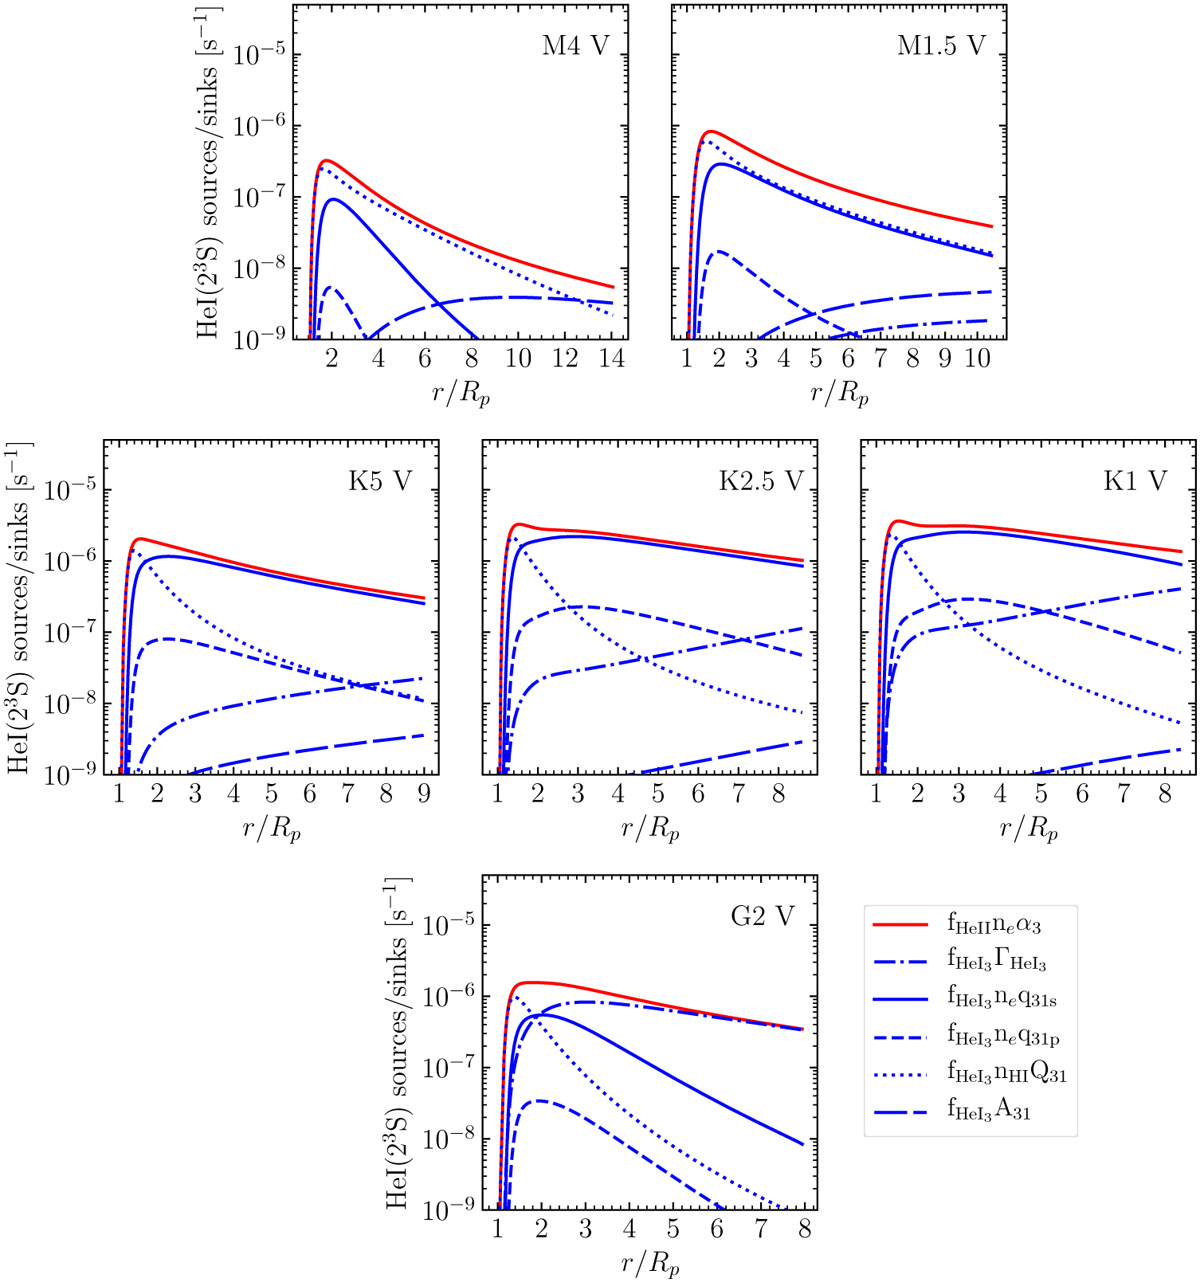
Reaction rates for the population and depopulation of the He I(23S) state for the simulations of HAT-P-11b shown in Figure 3 (both the q13 and advection rates are lower than 10−9 s−1).
Current usage metrics show cumulative count of Article Views (full-text article views including HTML views, PDF and ePub downloads, according to the available data) and Abstracts Views on Vision4Press platform.
Data correspond to usage on the plateform after 2015. The current usage metrics is available 48-96 hours after online publication and is updated daily on week days.
Initial download of the metrics may take a while.