Fig. 9.
Download original image
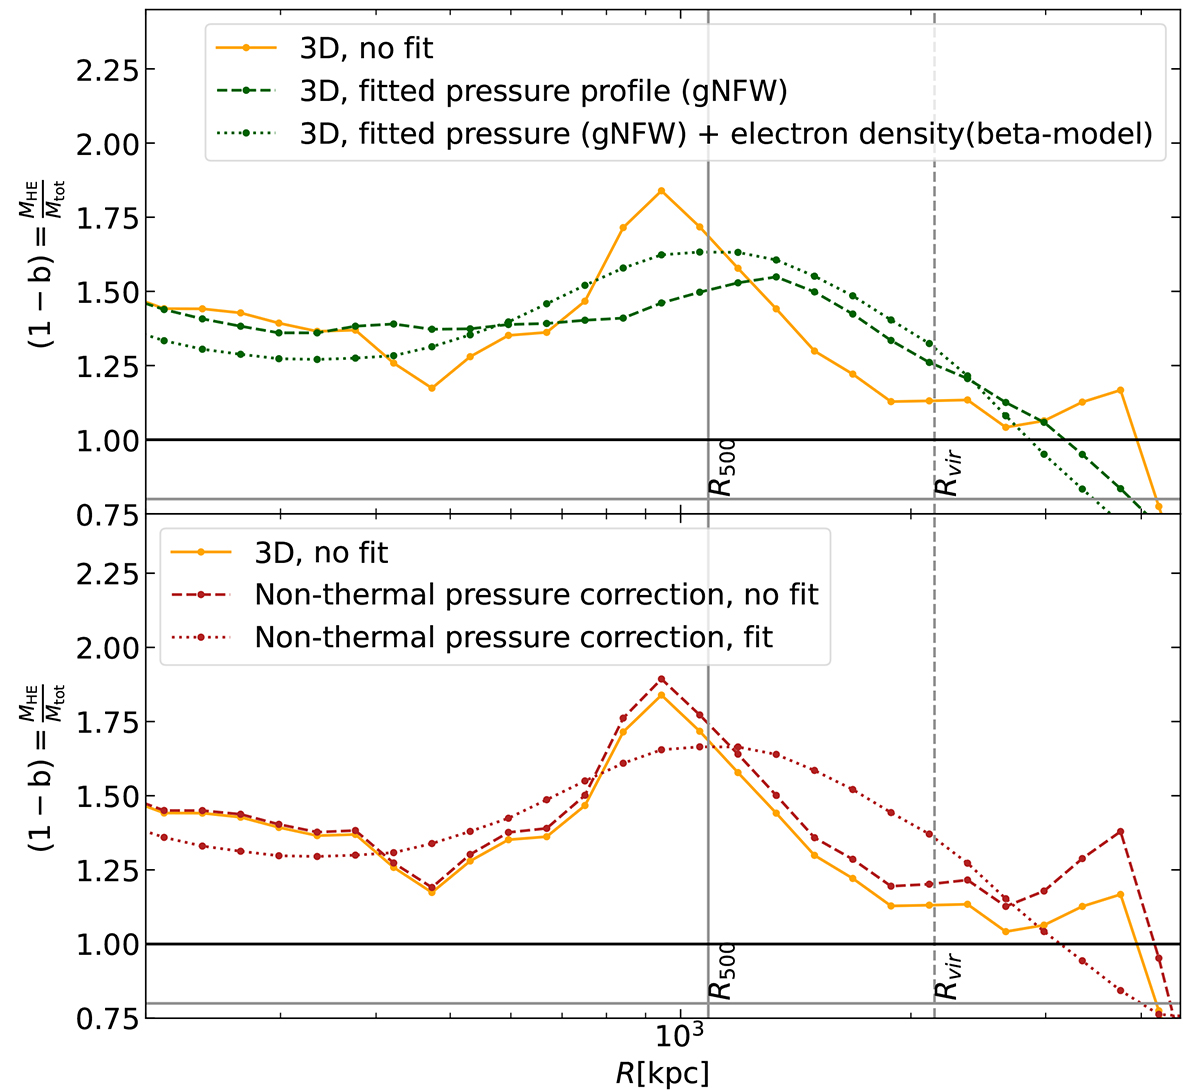
Hydrostatic mass biases estimated at different radii. For both panels, the orange line is the hydrostatic mass bias computed with the 3D radial profiles from the high-resolution simulation considering only thermal pressure. The vertical solid line is R500 and the vertical dashed line is the virial radius. Top: dark green dashed line is the bias, while only fitting the pressure to gNFW model, and the dark green dotted one is the bias while fitting both pressure and electron density profiles. Bottom: dark red lines stand for the hydrostatic mass bias with non-thermal pressure correction, with and without fitting the radial profiles to universal models (pressure, electron density and the α parameter), respectively, for the dotted and the dashed line styles. The bias deduced from both fitted pressure and electron density profiles has a similar trend to that obtained from simulation-derived profiles: the values are close at R500. Virgo being unrelaxed, adding non-thermal pressure increases the mass even more. The comparison between the bias deduced from fitted and simulation-derived profiles leads to the same conclusions as the top panel.
Current usage metrics show cumulative count of Article Views (full-text article views including HTML views, PDF and ePub downloads, according to the available data) and Abstracts Views on Vision4Press platform.
Data correspond to usage on the plateform after 2015. The current usage metrics is available 48-96 hours after online publication and is updated daily on week days.
Initial download of the metrics may take a while.