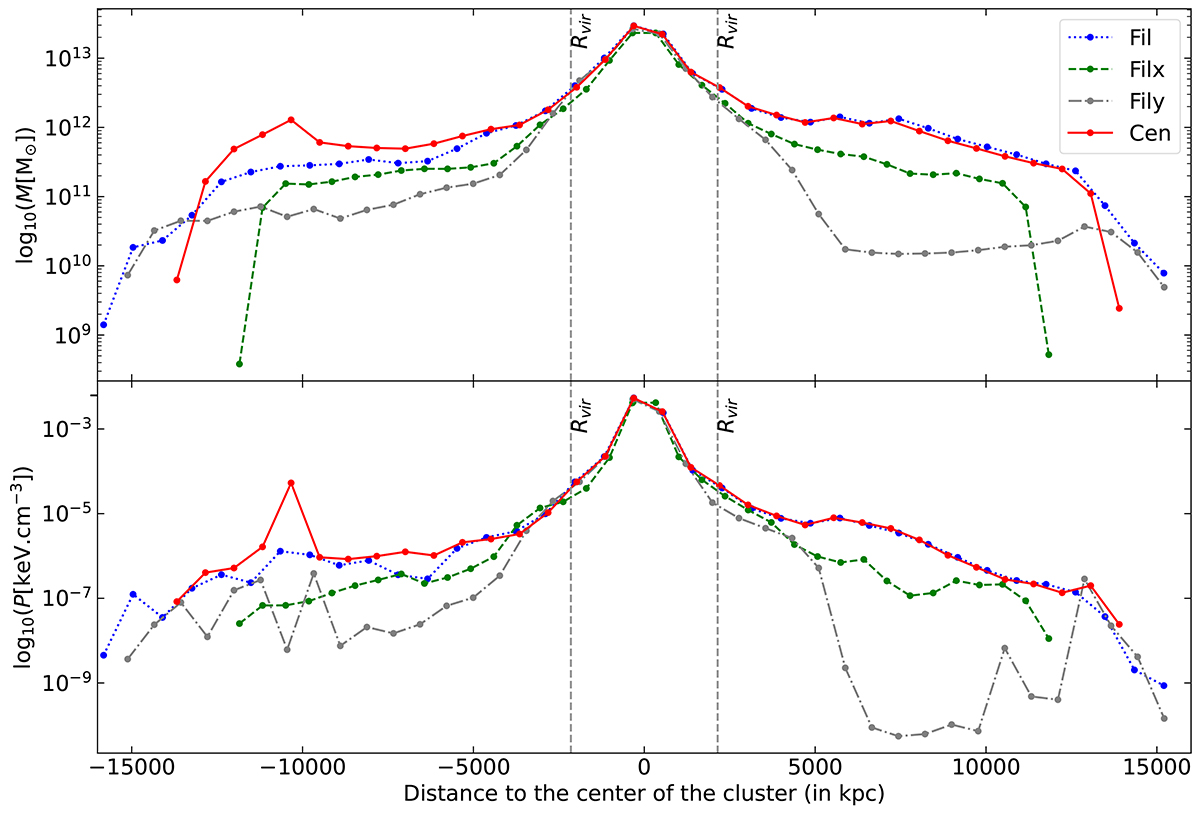
Fig. 8.
Download original image
Mass (top) and pressure (bottom) distributions along the LoSs of the four directions. The blue dotted profile is the Fil projection and the green dashed and grey dash-dotted profiles are the Filx and Fily projections, respectively. The solid red profile is the Cen projection. The dashed vertical lines show the virial radius. This figure validates the observed correlation (see Figs. 4 and 6) between the integrated mass in a given direction and the intensity of electron density and pressure 2D and 3D-deprojected profiles. The pressure drop at 150 kpc in the core of the Cen projection is explained by the presence of a 1012 M⊙ group of galaxies, most probably Canes Venaciti I, along this LoS at 10.3 Mpc from the cluster centre.
Current usage metrics show cumulative count of Article Views (full-text article views including HTML views, PDF and ePub downloads, according to the available data) and Abstracts Views on Vision4Press platform.
Data correspond to usage on the plateform after 2015. The current usage metrics is available 48-96 hours after online publication and is updated daily on week days.
Initial download of the metrics may take a while.