Fig. 7.
Download original image
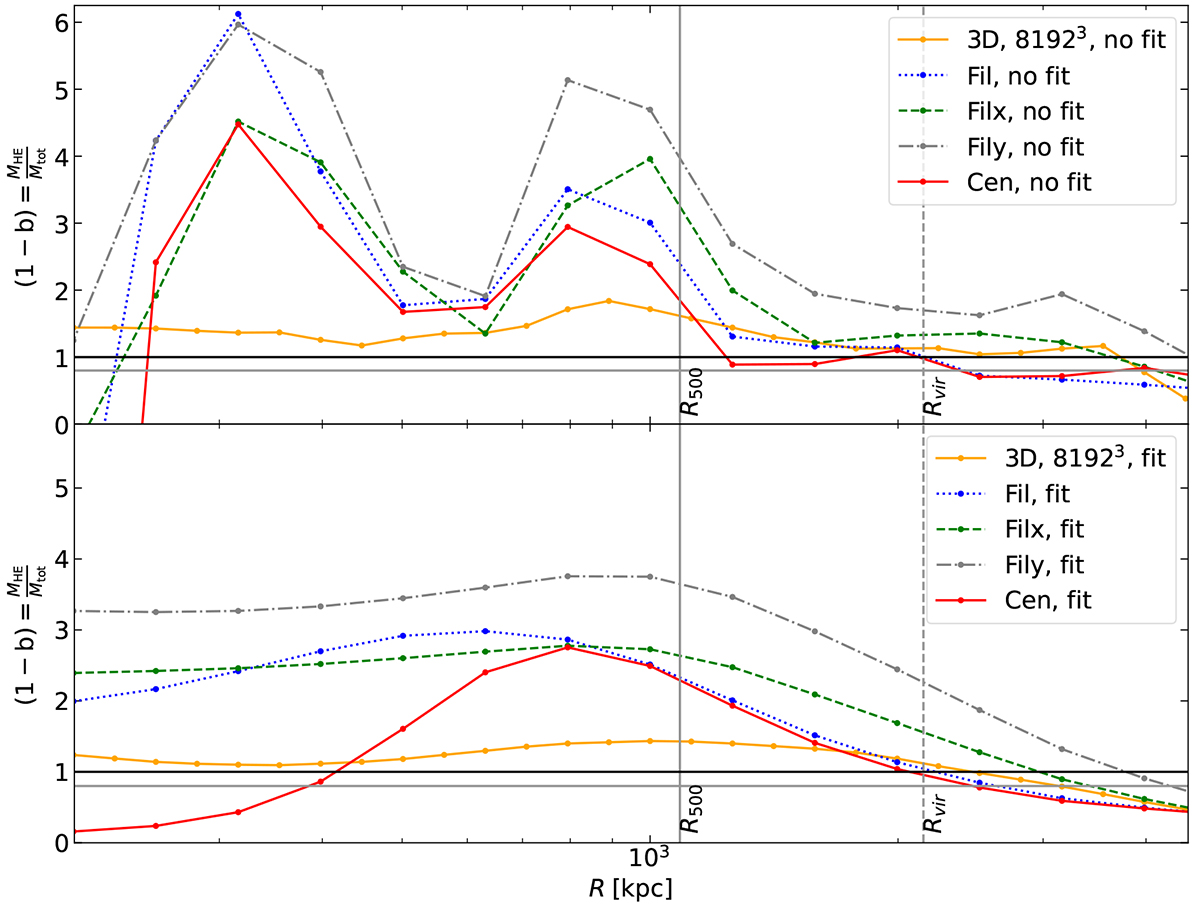
Hydrostatic mass biases estimated at different radii. In orange, the hydrostatic mass bias computed with the 3D radial profiles from the high-resolution simulation. The dashed lines represent the hydrostatic mass biases estimated with 3D-deprojected profiles from several projections. The blue dotted line is the Fil projection, the green dashed and grey dash-dotted lines are the Filx and Fily projections, respectively. The red solid profile is the Cen projection. For both panels, the vertical solid line is R500, the vertical dashed line is the virial radius. At around 300 and 850 kpc, the total mass is overestimated up to a factor 6 due to pressure discontinuities observed in Figs. 2 and 6. The large scatter in the projections at Rvir shows the impact of the integrated matter along each direction. The biases obtained from fitted profiles are lower at 300 and 850 kpc but consistent with those from simulation-derived profiles at R500 and Rvir.
Current usage metrics show cumulative count of Article Views (full-text article views including HTML views, PDF and ePub downloads, according to the available data) and Abstracts Views on Vision4Press platform.
Data correspond to usage on the plateform after 2015. The current usage metrics is available 48-96 hours after online publication and is updated daily on week days.
Initial download of the metrics may take a while.