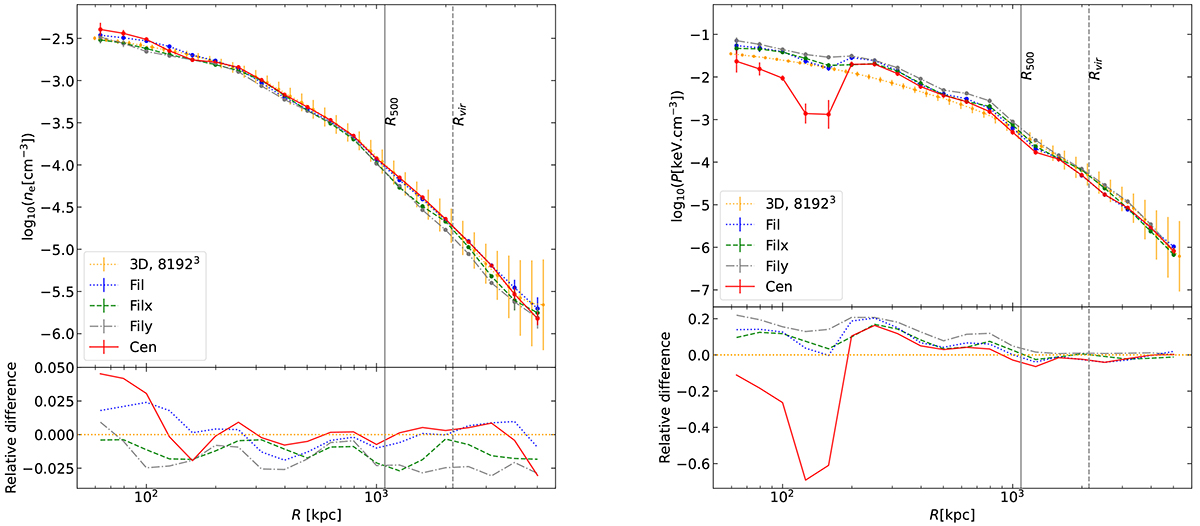
Fig. 6.
Download original image
3D radial electron density (top-left) and pressure (top-right) profile from the high-resolution simulation, in orange, compared to 3D-deprojected radial profiles. The blue dotted profile is the Fil projection, the green dashed and grey dash-dotted profiles are the Filx and Fily projections. The red solid profile is the Cen projection. The vertical solid line is R500, the vertical dashed line is the virial radius. The bottom panels show the relative difference to the 3D profile for both electron density and pressure profiles. Regarding the correlation between integrated mass in a given direction and profiles intensity, we observe the same trend as for Fig. 4. The electron density profiles are not very sensitive to the deprojection process, contrary to the pressure profiles, where the observed features are emphasised and consequently strongly impact the hydrostatic mass derived from these profiles.
Current usage metrics show cumulative count of Article Views (full-text article views including HTML views, PDF and ePub downloads, according to the available data) and Abstracts Views on Vision4Press platform.
Data correspond to usage on the plateform after 2015. The current usage metrics is available 48-96 hours after online publication and is updated daily on week days.
Initial download of the metrics may take a while.