Fig. 5.
Download original image
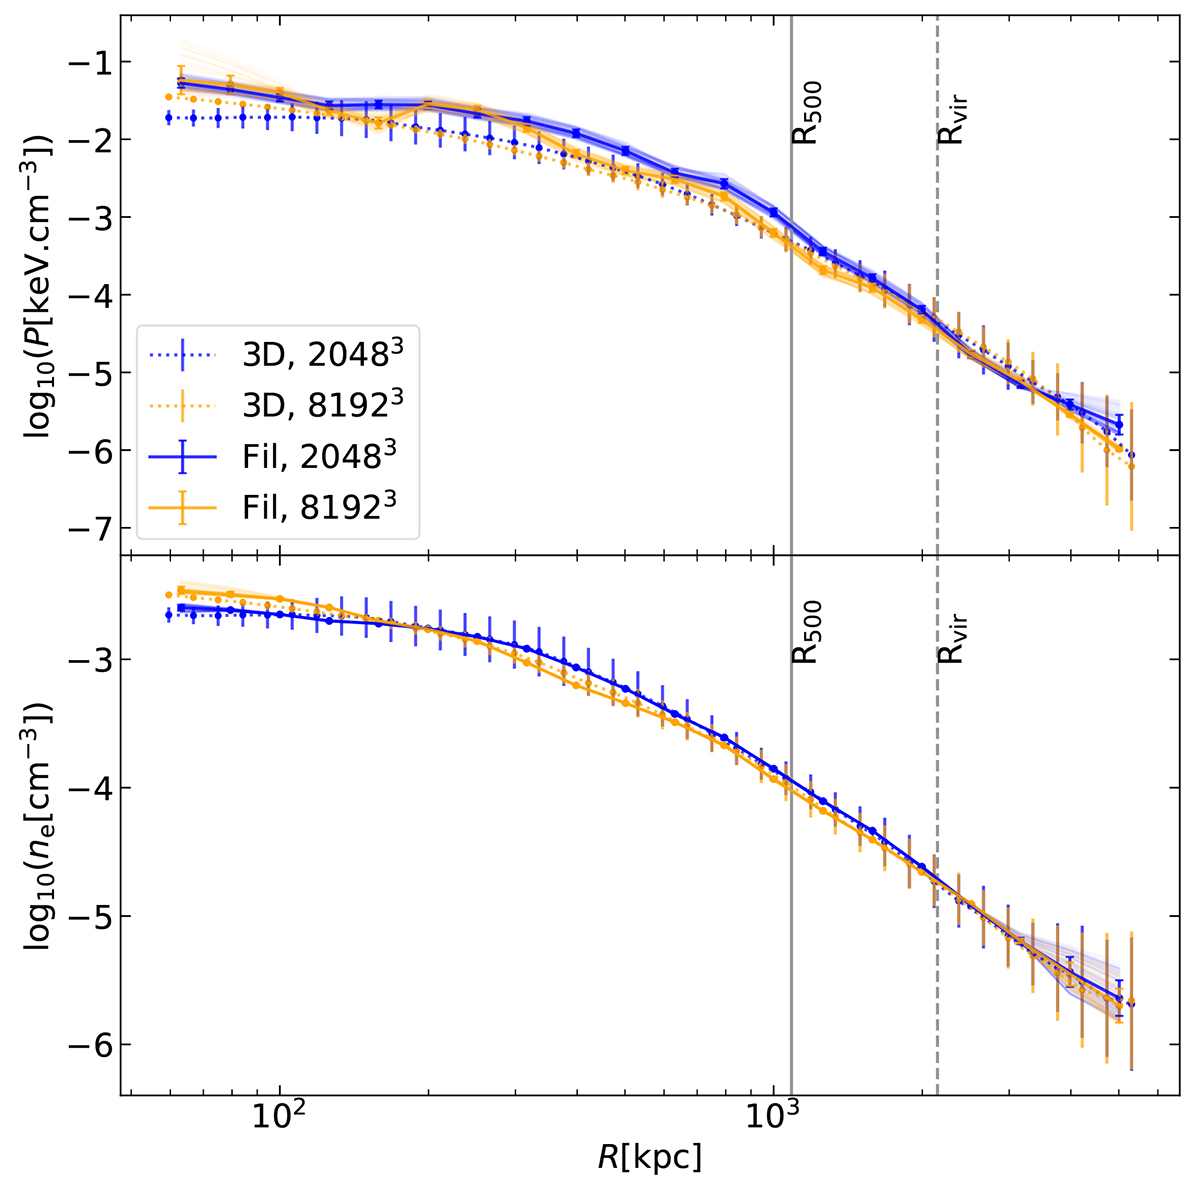
Radial pressure profiles: orange and blue dotted profiles are the 3D profiles made, respectively, with the high- and low-resolution simulations, and the error bars are the standard deviation. With the same colour code, the solid lines are the 3D-deprojected profiles extracted from the Fil projection. The pale lines are the 100 iterations of the Monte-Carlo smoothing method, and the error bars are the dispersion among these iterations in each bin. The vertical solid line is R500, the vertical dashed line is Rvir. 3D-deprojected profiles are less smooth than their 3D counterparts. The computation of the hydrostatic mass requires the gradients of these quantities, the observed irregularities have a significant impact on the mass estimates.
Current usage metrics show cumulative count of Article Views (full-text article views including HTML views, PDF and ePub downloads, according to the available data) and Abstracts Views on Vision4Press platform.
Data correspond to usage on the plateform after 2015. The current usage metrics is available 48-96 hours after online publication and is updated daily on week days.
Initial download of the metrics may take a while.