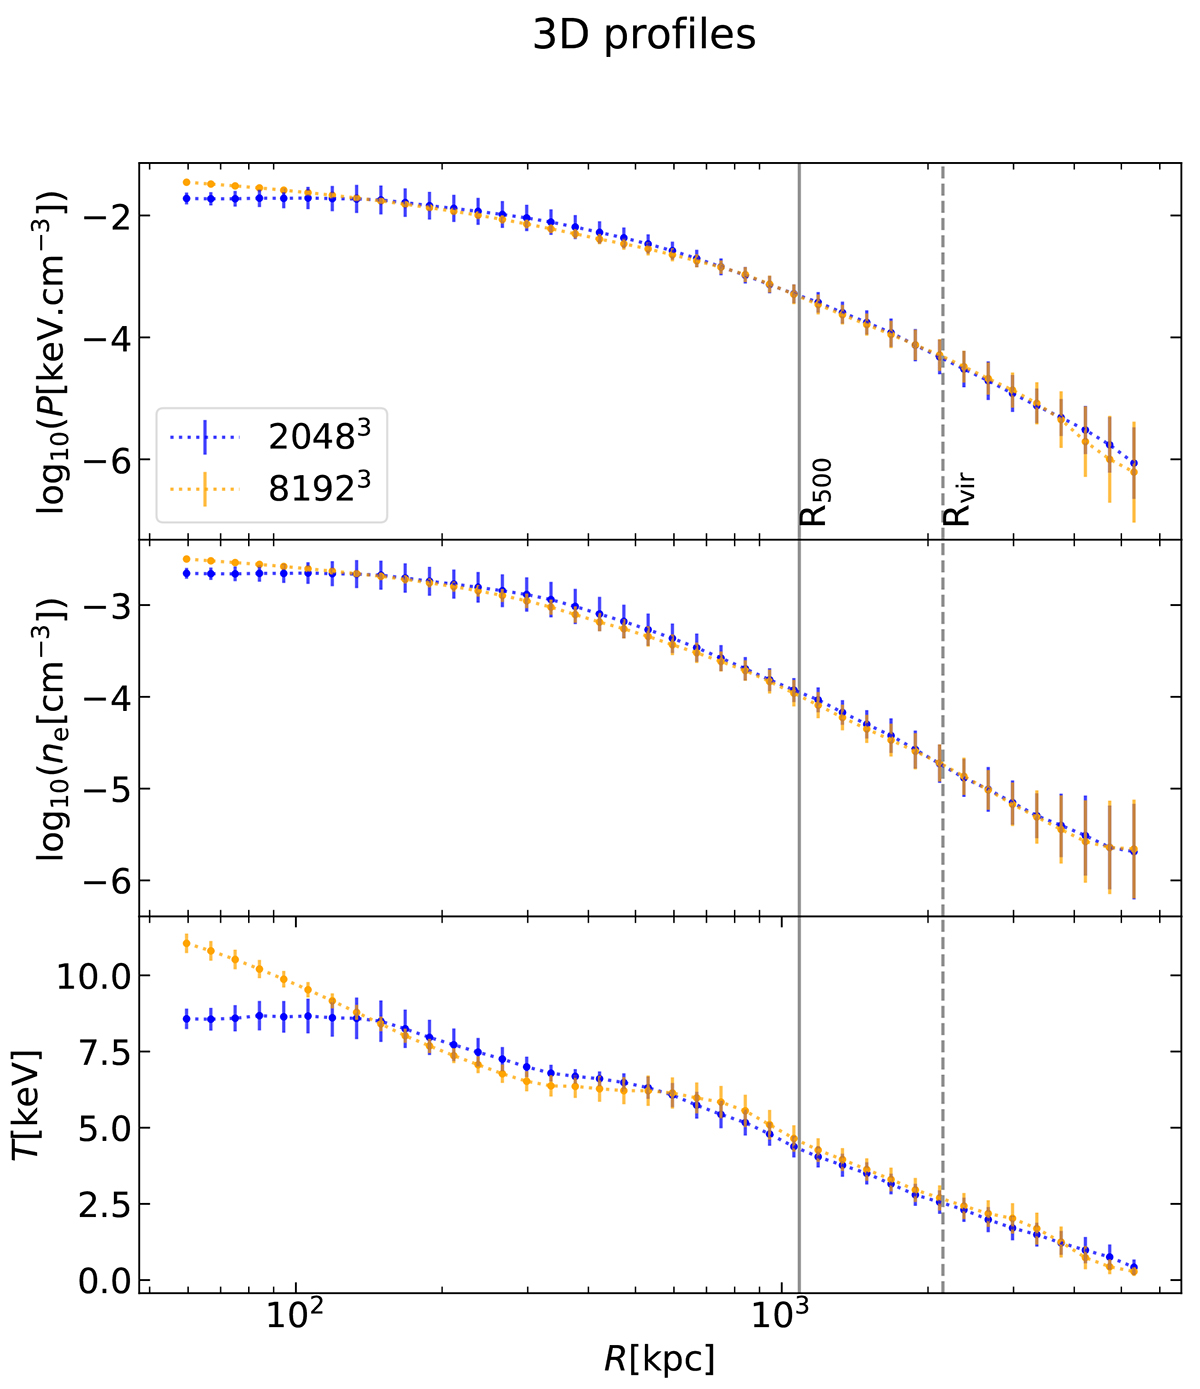
Fig. 3.
Download original image
3D radial profiles of mass-weighted mean of pressure (top, in keV cm3), electron density (middle, in cm−3), and temperature (bottom, in keV). The uncertainties are the mass-weighted standard deviation. The orange dotted lines stand for the high-resolution simulation (81923), and the blue dotted lines stand for the low-resolution simulation (20483). The profiles extend from 60 to 5300 kpc. The vertical solid line is for R500, and the dashed vertical line is for Rvir. Profiles derived from the high- and low-resolution simulations are consistent, except in the cluster core. The low-resolution simulation has converged outward from at least R500.
Current usage metrics show cumulative count of Article Views (full-text article views including HTML views, PDF and ePub downloads, according to the available data) and Abstracts Views on Vision4Press platform.
Data correspond to usage on the plateform after 2015. The current usage metrics is available 48-96 hours after online publication and is updated daily on week days.
Initial download of the metrics may take a while.