Fig. 2.
Download original image
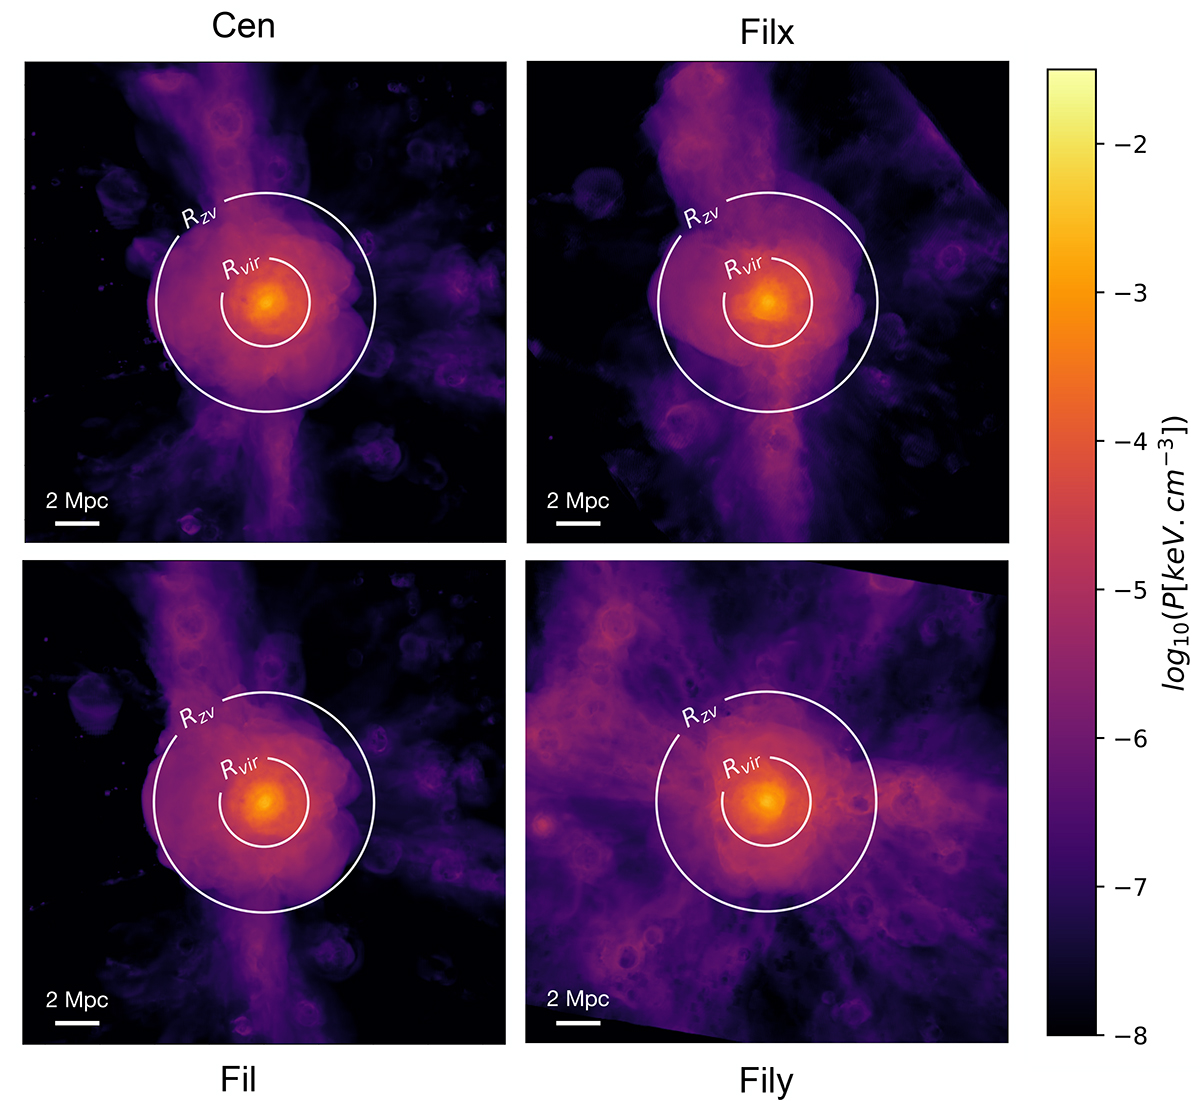
Pressure maps in four directions from the high-resolution zoom-in simulation. The maps are 22.123 Mpc wide and contain 15 7282 pixels. The central circle is the virial radius, the outer one is the zero velocity radius. The colour scale ranges from 10−8 to 10−1.5 kev cm−3. From top to bottom and left to right, the Cen, Fil, Filx, and Fily projections associated with directions shown in Fig. 1. These maps show the matter distribution in Virgo’s local environment. The cluster is part of a matter sheet (visible on the Fily projection) including a main filament (top of the Filx projection) and three secondary filaments (bottom of the Filx projection and top and bottom of the Fil and Cen projections).
Current usage metrics show cumulative count of Article Views (full-text article views including HTML views, PDF and ePub downloads, according to the available data) and Abstracts Views on Vision4Press platform.
Data correspond to usage on the plateform after 2015. The current usage metrics is available 48-96 hours after online publication and is updated daily on week days.
Initial download of the metrics may take a while.