Fig. 4
Download original image
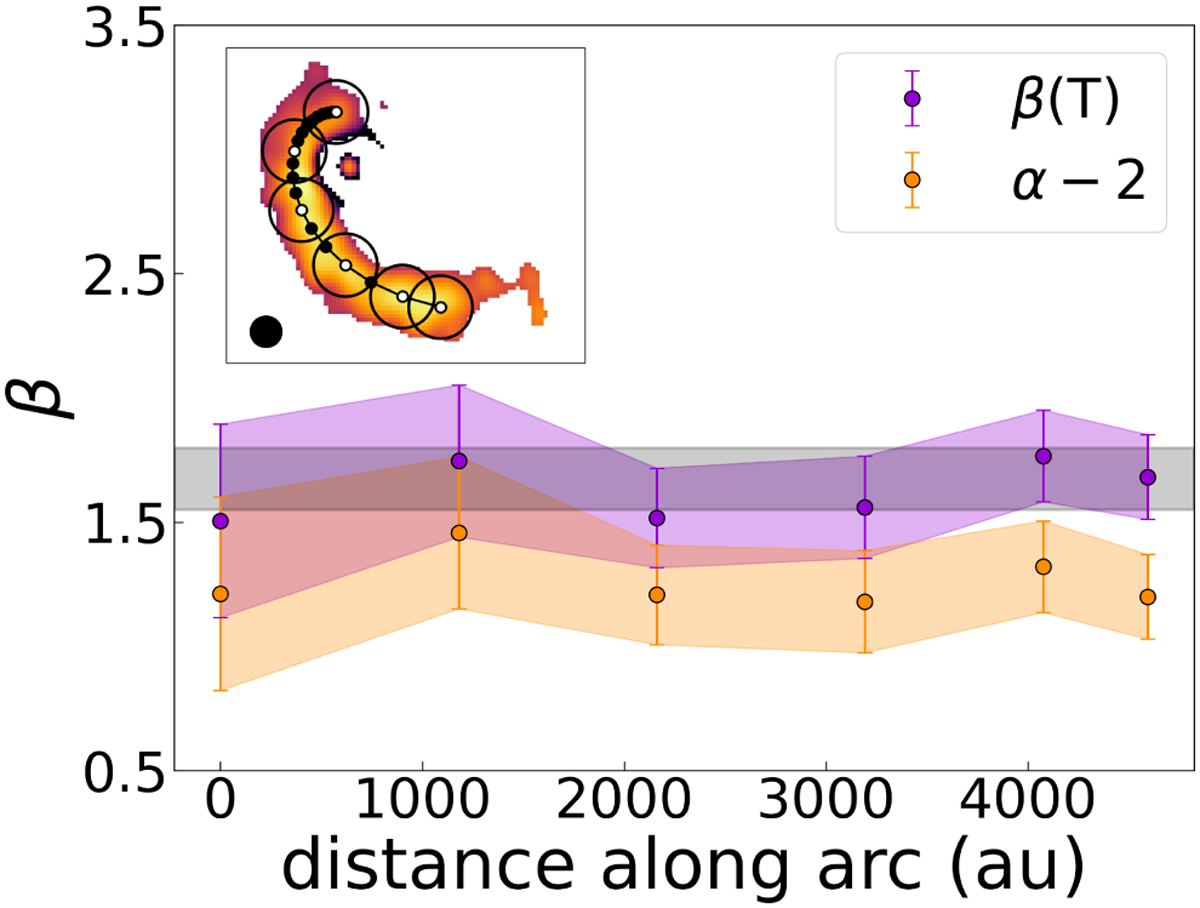
Profile of the spectral index β of the dust opacity along the length of the streamer. The approximation β = α − 2 is shown as the orange line, and β, corrected for the deviation from the RJ approximation, is shown as the violet line. This profile has been obtained starting from the maps in Fig. 3, where the central emission had been modeled and subtracted. The centers of the selected apertures in which we derive β are highlighted in white among all the points that sample the manually defined logarithmic spiral in the B6 map as an example (upper inset). Throughout the whole structure, β ~ 1.6. The gray band represents ISM-like β.
Current usage metrics show cumulative count of Article Views (full-text article views including HTML views, PDF and ePub downloads, according to the available data) and Abstracts Views on Vision4Press platform.
Data correspond to usage on the plateform after 2015. The current usage metrics is available 48-96 hours after online publication and is updated daily on week days.
Initial download of the metrics may take a while.