Fig. 2
Download original image
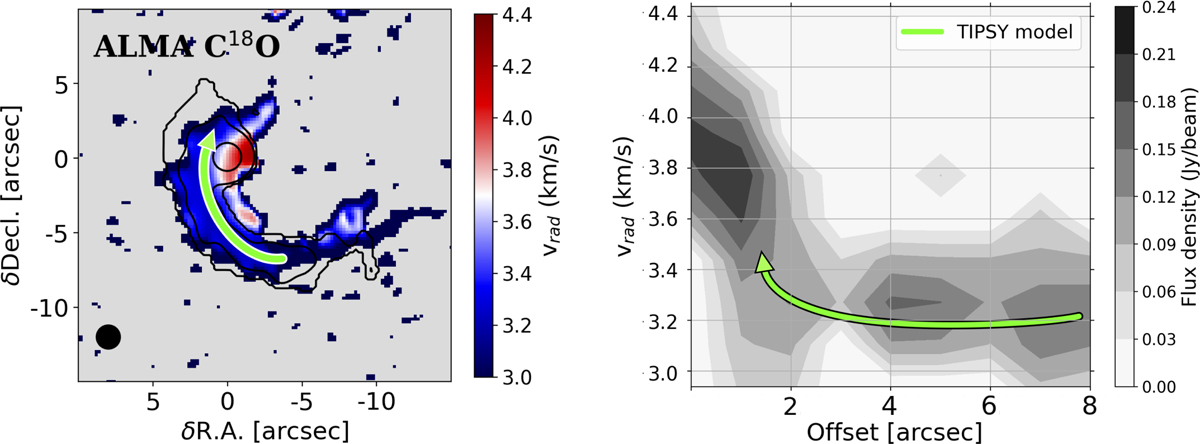
Moment-one map of the 18CO J = 2−1 transition (>2σ) around M512 (left). The black contours are the B6 continuum [3, 10, 100]σ levels. The green line is the TIPSY model trajectory for M = 0.15 M⊙ and vsys = 3.25 km s−1. The position-velocity diagram of the streamer emission (grey contours) is extracted along the TIPSY trajectory and includes the inner protostellar region (right). The TIPSY fit to the radial velocities is reported as a green line.
Current usage metrics show cumulative count of Article Views (full-text article views including HTML views, PDF and ePub downloads, according to the available data) and Abstracts Views on Vision4Press platform.
Data correspond to usage on the plateform after 2015. The current usage metrics is available 48-96 hours after online publication and is updated daily on week days.
Initial download of the metrics may take a while.