Fig. 1
Download original image
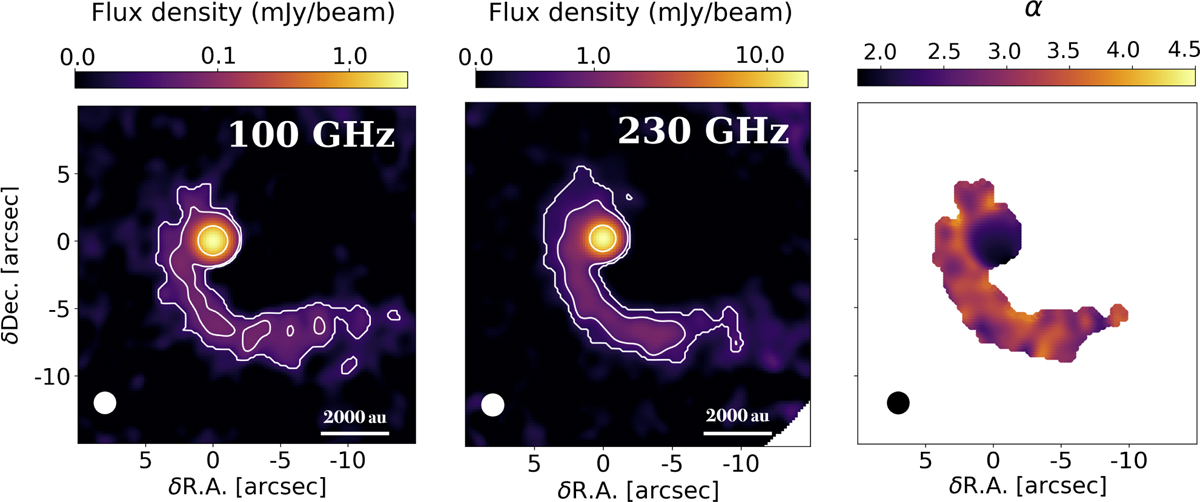
ALMA Band 3 (100 GHz) continuum emission of M512 with [3, 7, 100]σ contours overplotted in white (left). ALMA Band 6 (230 GHz) with [3, 10, 100]σ contours overplotted in white (center). The spectral index as measured from Eq. (1) using only pixels with flux above the 3σ noise level (right). The x- and y-axes report the offset from the central source in arcseconds. The color bars represent the flux density (mJy beam−1) for the ALMA observations (left, center) and the value of the spectral index (right). The images have been created applying a uv taper to the visibilities, with Briggs weighting and robust = 1. Then we have smoothed them to the same resolution of 1″.6, which is roughly the width of the extended emission. The beam is reported in the lower left corner.
Current usage metrics show cumulative count of Article Views (full-text article views including HTML views, PDF and ePub downloads, according to the available data) and Abstracts Views on Vision4Press platform.
Data correspond to usage on the plateform after 2015. The current usage metrics is available 48-96 hours after online publication and is updated daily on week days.
Initial download of the metrics may take a while.