Open Access
Fig. B.2
Download original image
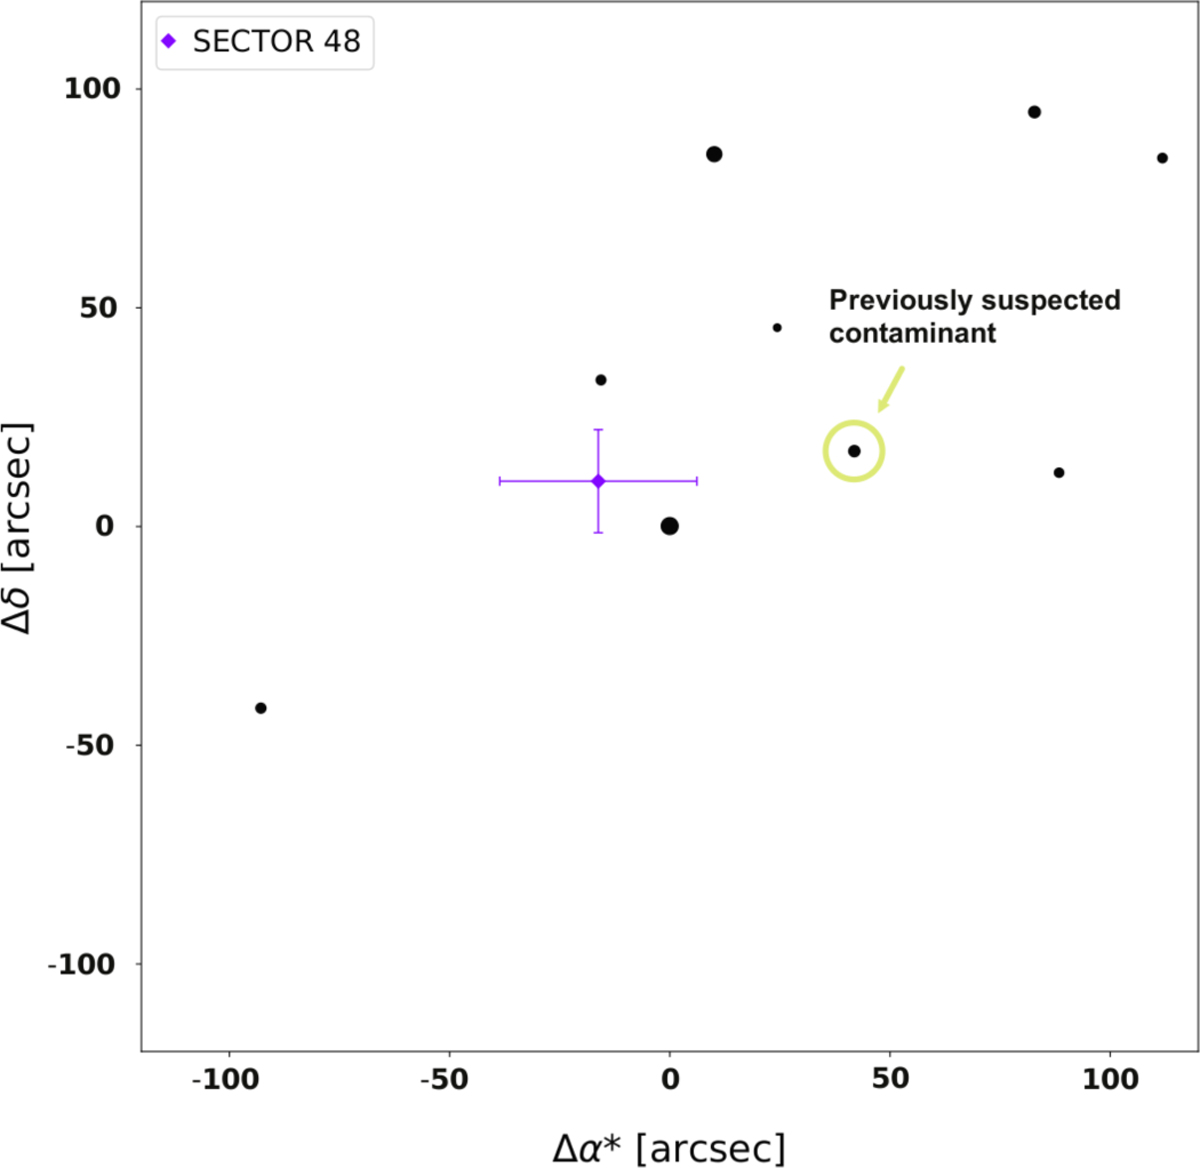
Computation of the in- and out-of-transit difference centroid test for Sector 48 (violet dot and error bars). The potential contaminant star’s location is instead surrounded by a green circle.
Current usage metrics show cumulative count of Article Views (full-text article views including HTML views, PDF and ePub downloads, according to the available data) and Abstracts Views on Vision4Press platform.
Data correspond to usage on the plateform after 2015. The current usage metrics is available 48-96 hours after online publication and is updated daily on week days.
Initial download of the metrics may take a while.