Open Access
Fig. 5.
Download original image
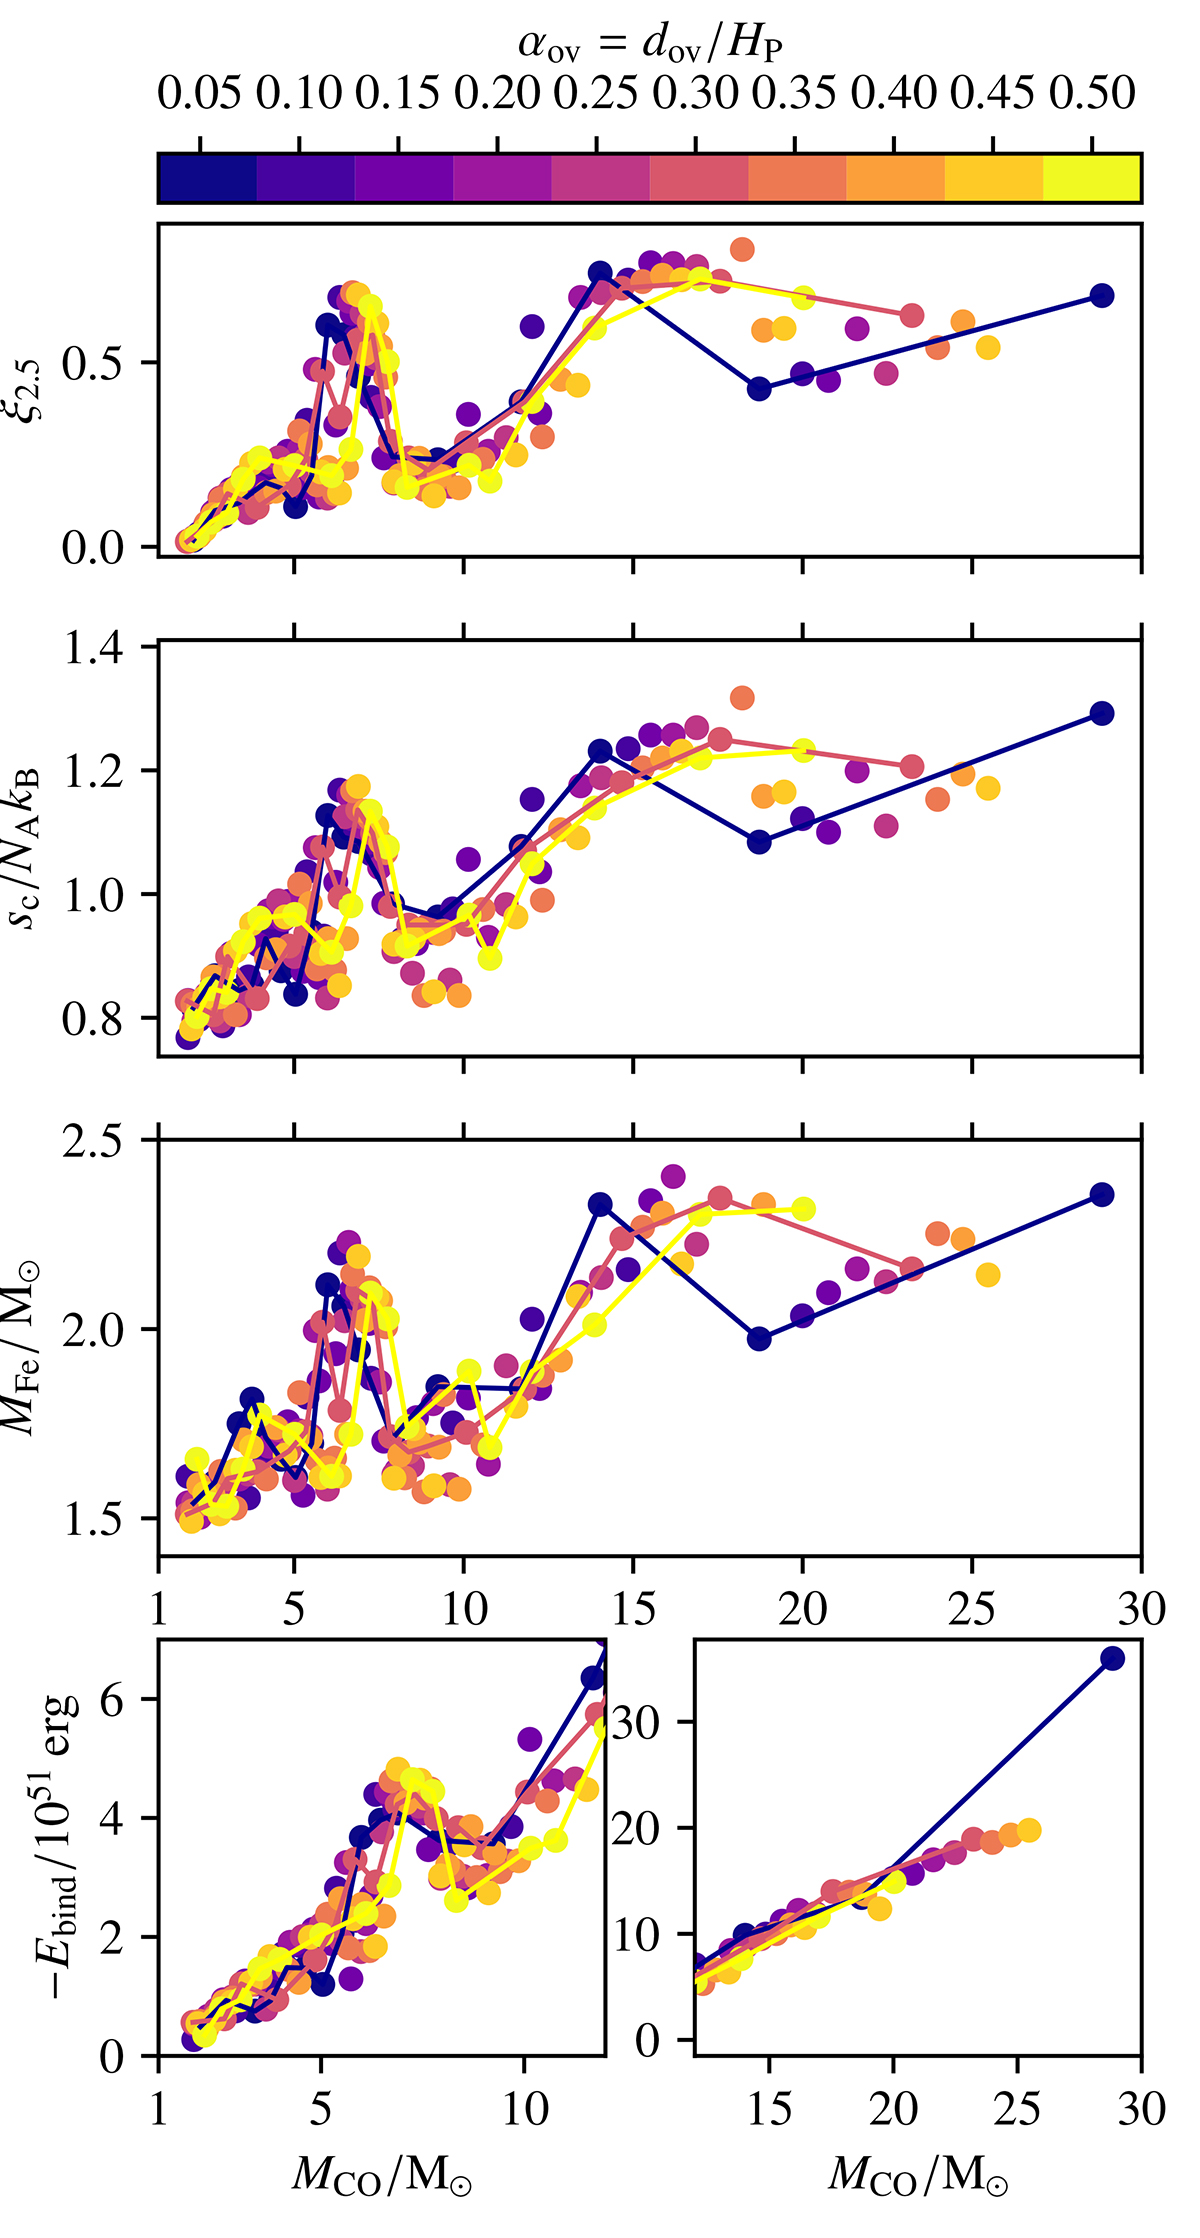
Similar to Fig. 4, but as a function of the CO core mass at the end of core He burning for all models. Colors show models of different convective core overshooting values. The blue, pink, and yellow lines connect models with the same convective core overshooting value for αov = 0.05, 0.30, and 0.50.
Current usage metrics show cumulative count of Article Views (full-text article views including HTML views, PDF and ePub downloads, according to the available data) and Abstracts Views on Vision4Press platform.
Data correspond to usage on the plateform after 2015. The current usage metrics is available 48-96 hours after online publication and is updated daily on week days.
Initial download of the metrics may take a while.