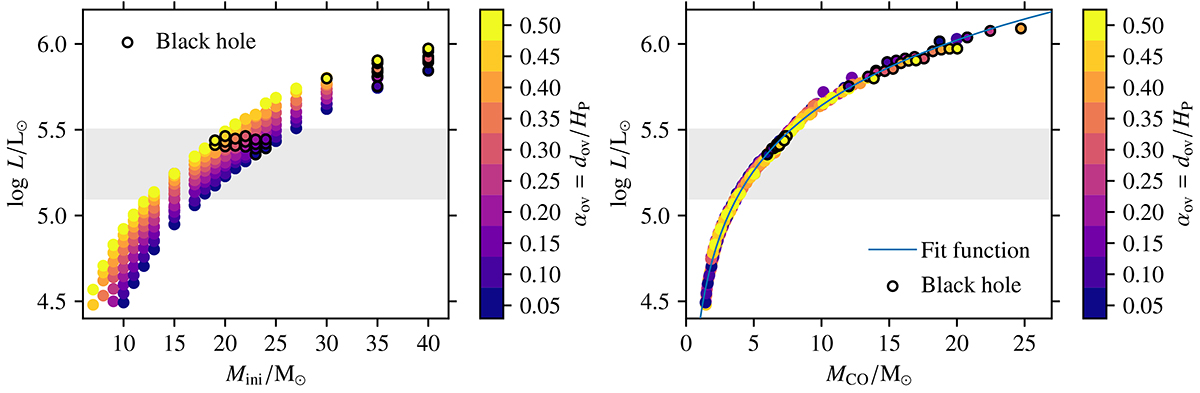
Fig. 13.
Download original image
Luminosity of pre-SN models at the end of core-carbon burning, as a function of initial mass (left) and CO core mass (right). The colors represent different values of convective core overshooting and the black circles indicate models that are expected to collapse into BHs. The gray-shaded region is the range of luminosity in which no SN IIP progenitors have been observed so far 5.1 ≤ log(L/L⊙)≤5.5 (Davies & Beasor 2020). The blue line in the right panel shows our fit function to the luminosity and CO core masses of our models (see text).
Current usage metrics show cumulative count of Article Views (full-text article views including HTML views, PDF and ePub downloads, according to the available data) and Abstracts Views on Vision4Press platform.
Data correspond to usage on the plateform after 2015. The current usage metrics is available 48-96 hours after online publication and is updated daily on week days.
Initial download of the metrics may take a while.