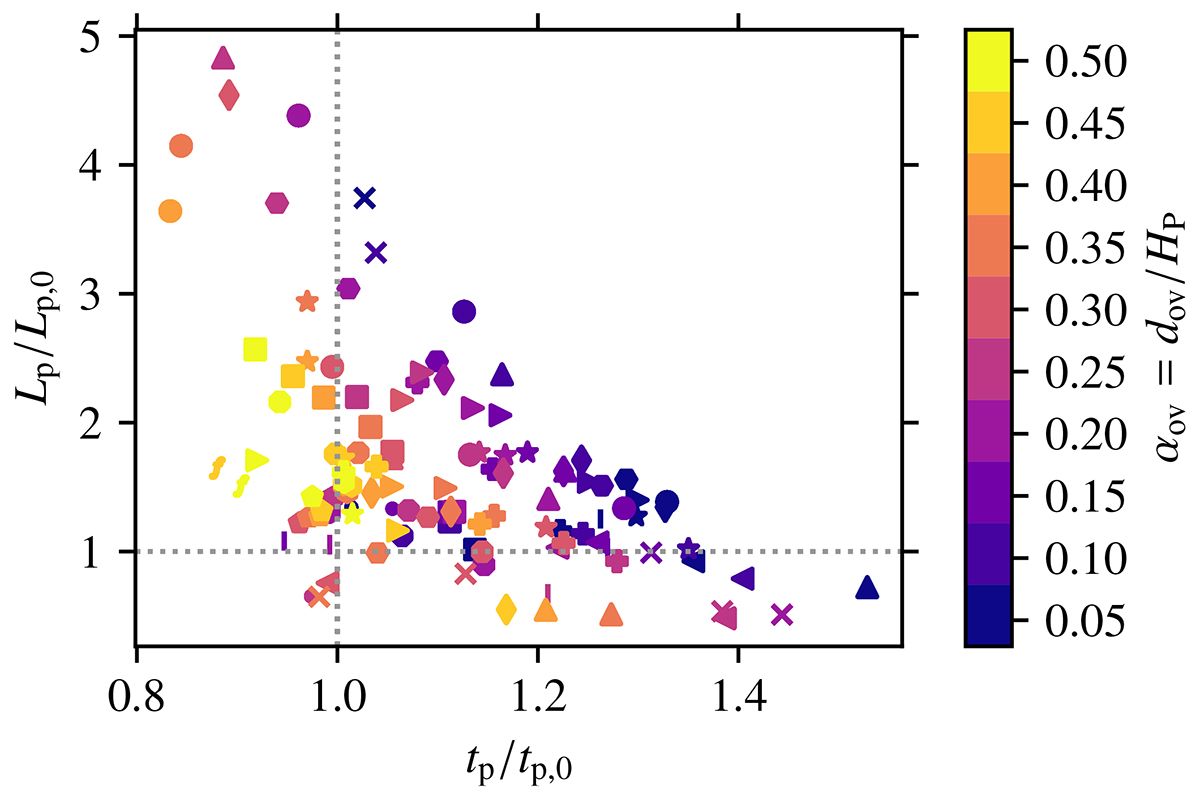
Fig. 12.
Download original image
Expected plateau luminosity of SN light-curve as a function of the duration of the plateau for our SN IIP progenitor models. Markers indicate models of the same initial mass, and colors indicate different convective core overshooting values. The black-dotted lines indicate typical values of Lp, 0 = 1042 erg s−1 and tp, 0 = 100 days that are calibrated for RSGs with an Mej = 10 M⊙, Eexpl = 1051 erg, and R = 500 R⊙.
Current usage metrics show cumulative count of Article Views (full-text article views including HTML views, PDF and ePub downloads, according to the available data) and Abstracts Views on Vision4Press platform.
Data correspond to usage on the plateform after 2015. The current usage metrics is available 48-96 hours after online publication and is updated daily on week days.
Initial download of the metrics may take a while.