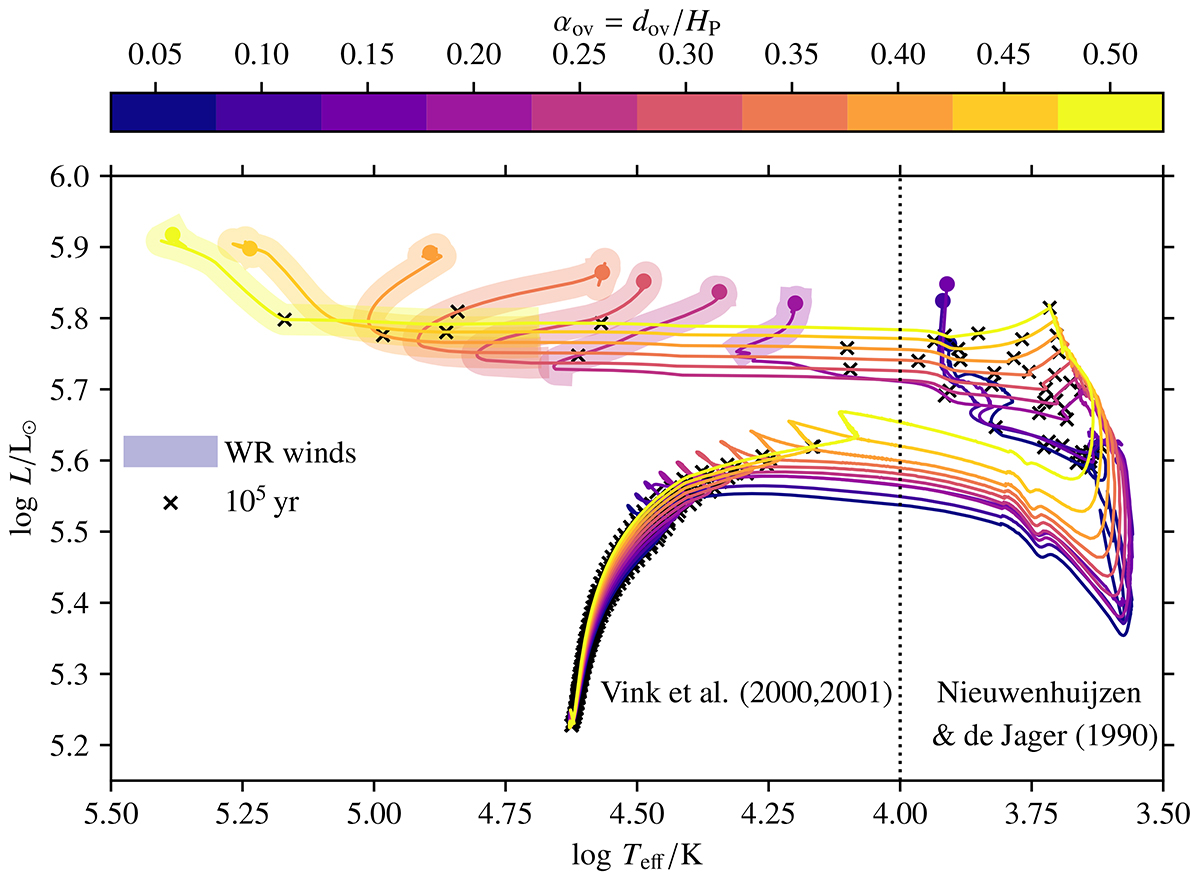
Fig. 1.

Download original image
Evolution of initially 35 M⊙ models from the zero-age main sequence until the onset of iron core collapse (filled circles). Colors show models of different convective core overshooting values. Black crosses indicate intervals of 105 yr. The black dotted line marks the transition from the hot to the cool wind mass loss regime at log(Teff/K) = 4. Thick lines show where Wolf-Rayet wind mass-loss rates are applied.
Current usage metrics show cumulative count of Article Views (full-text article views including HTML views, PDF and ePub downloads, according to the available data) and Abstracts Views on Vision4Press platform.
Data correspond to usage on the plateform after 2015. The current usage metrics is available 48-96 hours after online publication and is updated daily on week days.
Initial download of the metrics may take a while.


