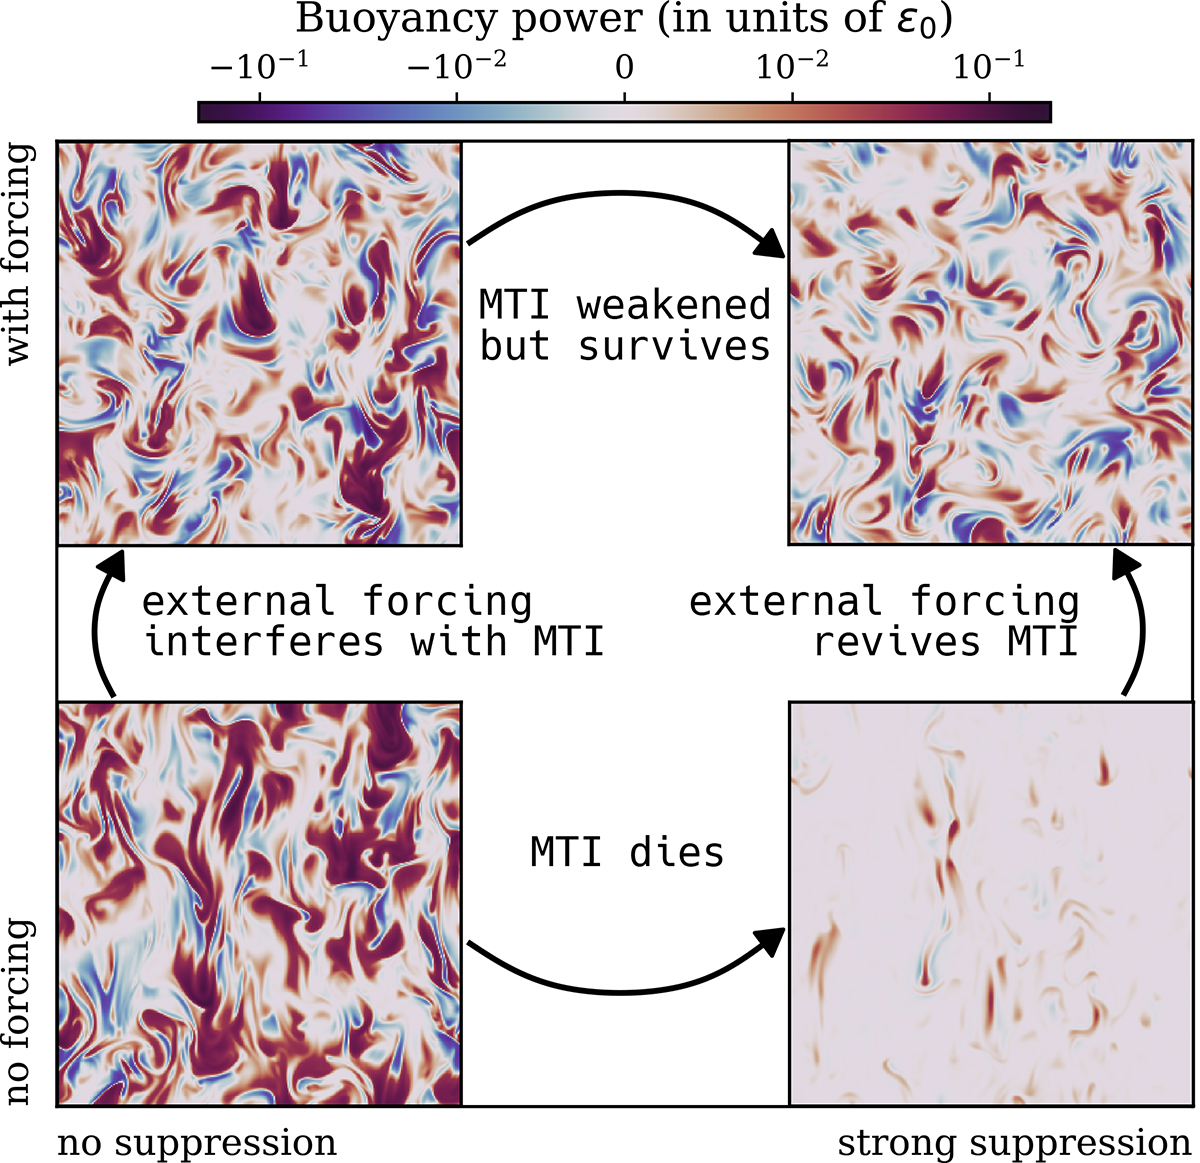
Fig. 4.
Download original image
Buoyancy power for two 3D runs (reference MTI and strongly whistler-suppressed MTI) before and after turning on external forcing. The buoyancy power is in units of the MTI energy injection rate and its volume average is shown in Fig. 3. External forcing interferes with MTI turbulence, but the upwelling and downwelling of the plasma is still present (regions in red).
Current usage metrics show cumulative count of Article Views (full-text article views including HTML views, PDF and ePub downloads, according to the available data) and Abstracts Views on Vision4Press platform.
Data correspond to usage on the plateform after 2015. The current usage metrics is available 48-96 hours after online publication and is updated daily on week days.
Initial download of the metrics may take a while.