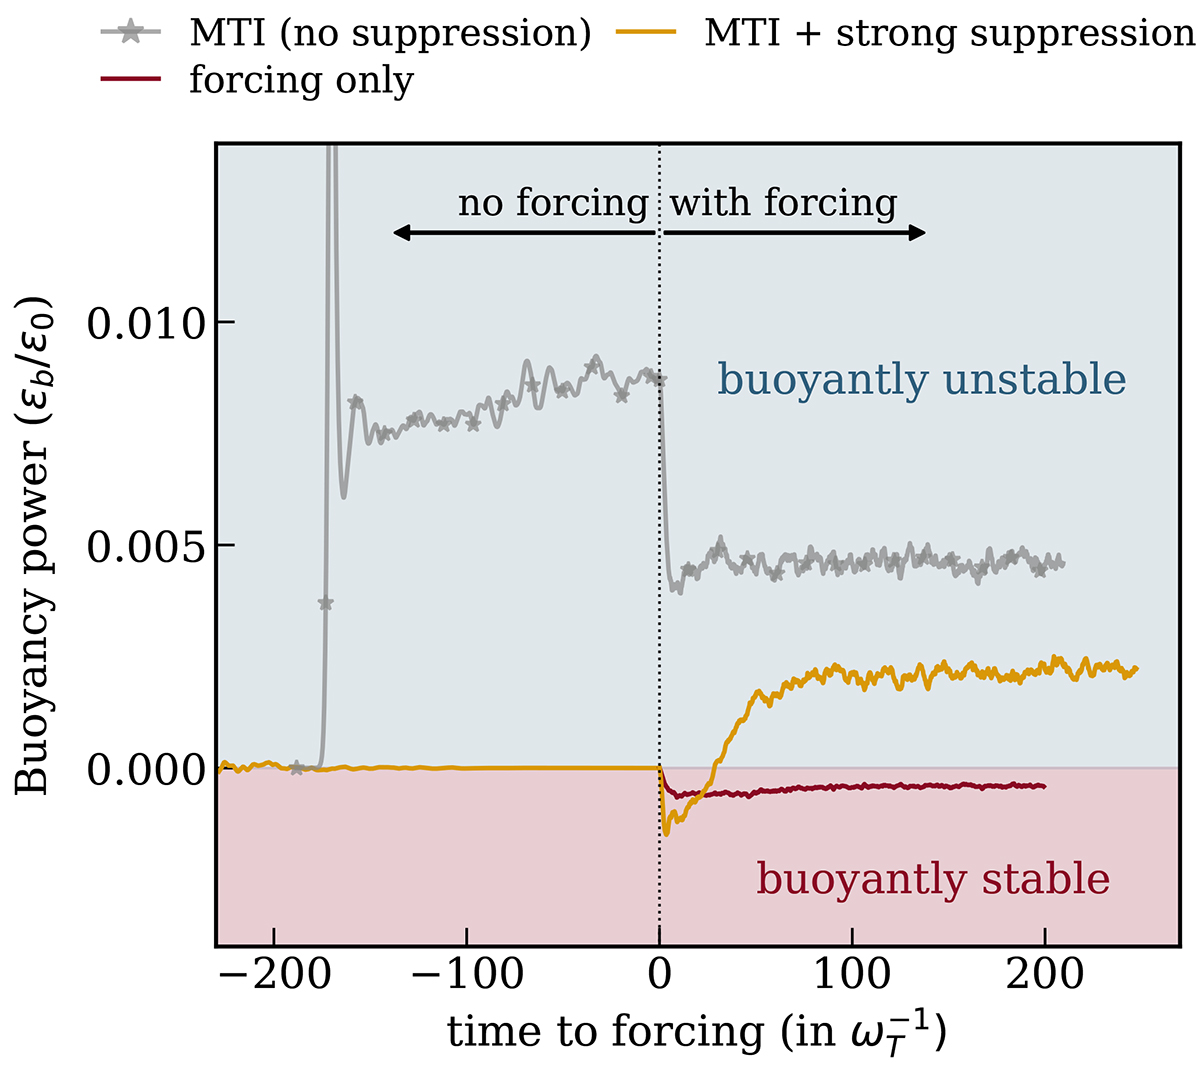
Fig. 3.
Download original image
Evolution of the volume-averaged buoyancy power in 3D MTI with whistler suppression. To the left of the vertical dotted line the runs have no additional external forcing, which is turned on at t = 0. The buoyancy power is normalized to ![]() , the MTI energy injection rate (PL22a). The 3D runs shown are the same as in Fig. 2. Despite strong whistler suppression, the system remains buoyantly unstable thanks to external forcing.
, the MTI energy injection rate (PL22a). The 3D runs shown are the same as in Fig. 2. Despite strong whistler suppression, the system remains buoyantly unstable thanks to external forcing.
Current usage metrics show cumulative count of Article Views (full-text article views including HTML views, PDF and ePub downloads, according to the available data) and Abstracts Views on Vision4Press platform.
Data correspond to usage on the plateform after 2015. The current usage metrics is available 48-96 hours after online publication and is updated daily on week days.
Initial download of the metrics may take a while.