Fig. 1.
Download original image
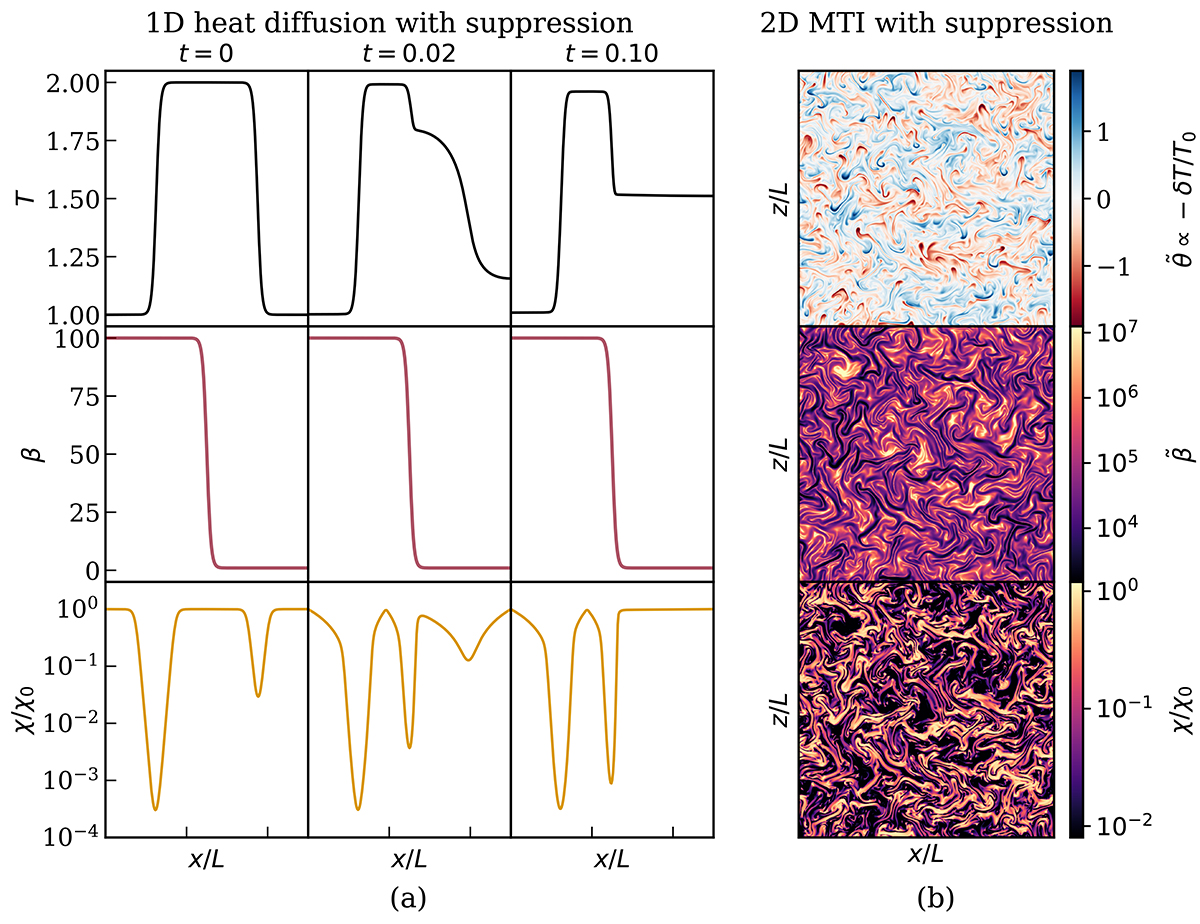
Implementation of whistler suppression in 1D and 2D with the MTI. Part (a): 1D simulation illustrating the behavior of whistler-suppressed thermal conduction. The temperature (top), plasma β (middle, kept fixed), and thermal conductivity (bottom) are shown at different times (in units of L2/χ0, with L the box size). For this 1D example the suppression factor has the form χ/χ0 = (1 + LβdlnT/dx)−1 such that heat conduction is suppressed at strong temperature gradients and high β. Temperature equilibration thus occurs faster on the right (where β is low) than on the left (where β is high). Part (b): Snapshots at saturation of 2D MTI turbulence with a similar form of whistler suppression (Eq. (3)). Shown are temperature fluctuations (top), the Boussinesq equivalent of plasma beta ![]() (middle), and the spatially varying heat conductivity χ (bottom). The suppression of χ is seen to spatially correlate with regions of high
(middle), and the spatially varying heat conductivity χ (bottom). The suppression of χ is seen to spatially correlate with regions of high ![]() . The MTI-driven temperature fluctuations reveal that the MTI continues to work despite the whistler suppression of the thermal diffusivity, which amounts to 20% of χ0 (volume average).
. The MTI-driven temperature fluctuations reveal that the MTI continues to work despite the whistler suppression of the thermal diffusivity, which amounts to 20% of χ0 (volume average).
Current usage metrics show cumulative count of Article Views (full-text article views including HTML views, PDF and ePub downloads, according to the available data) and Abstracts Views on Vision4Press platform.
Data correspond to usage on the plateform after 2015. The current usage metrics is available 48-96 hours after online publication and is updated daily on week days.
Initial download of the metrics may take a while.