Fig. 7
Download original image
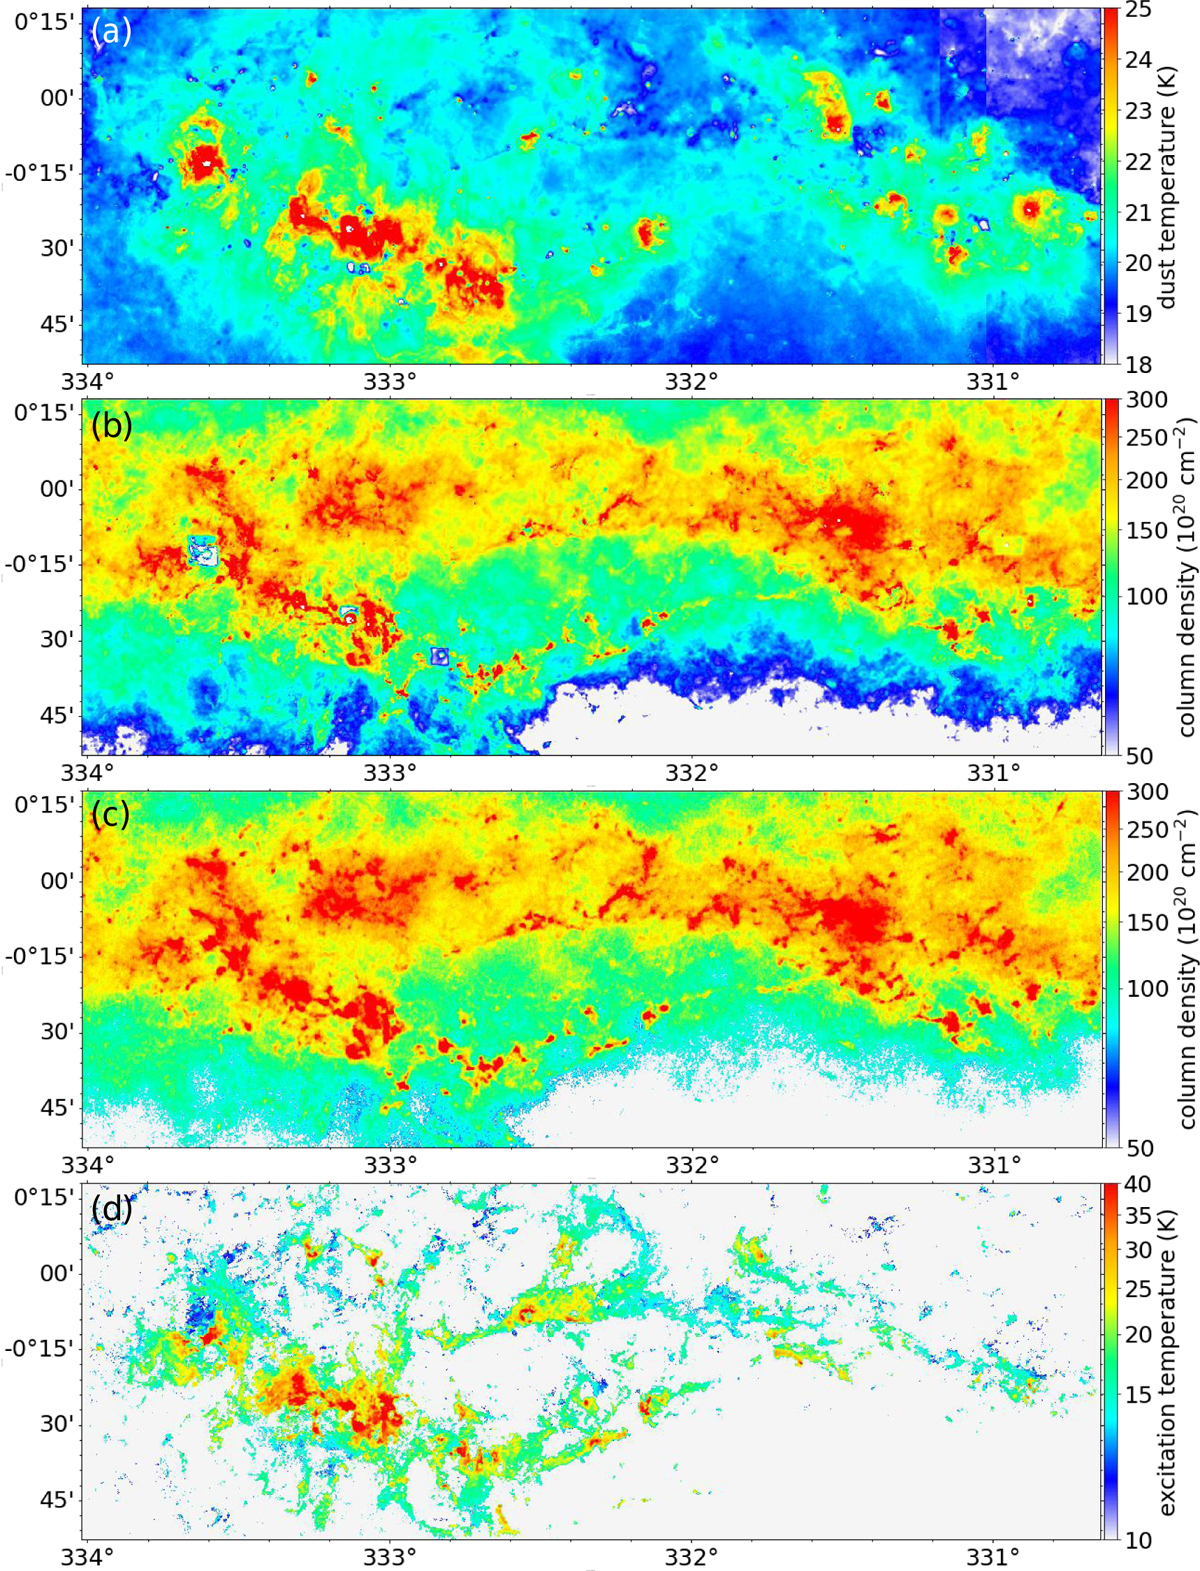
Temperature and column density maps of the entire field. (a) and (b) Dust temperature and column density distributions in the G333 complex and the G331 GMC derived from Hi-GAL data processed by PPMAP, respectively. (c) Column density distribution in the G333 complex and the G331 GMC derived from ATLASGAL+Planck 870 µm data. (d) Excitation temperature distribution in the G333 complex derived from 12CO (3−2) emission by an LTE analysis in the velocity range [−60, −35] km s−1.
Current usage metrics show cumulative count of Article Views (full-text article views including HTML views, PDF and ePub downloads, according to the available data) and Abstracts Views on Vision4Press platform.
Data correspond to usage on the plateform after 2015. The current usage metrics is available 48-96 hours after online publication and is updated daily on week days.
Initial download of the metrics may take a while.