Fig. 5
Download original image
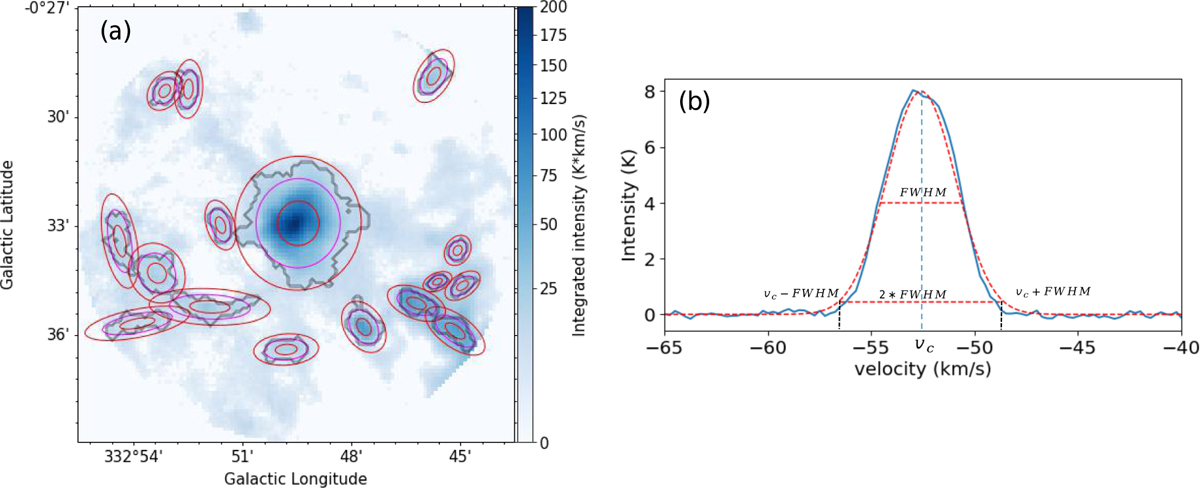
Part of subregion S3 in Fig. 2c used to illustrate the structures identified by the Dendrogram algorithm, (a) The black contours show the masks of Dendrogram leaves. The long and short axes of the smallest ellipse a and b are the rms sizes (second moments) of the intensity distribution. The ellipses in the second and third layers are enlarged by factors of 2 and 3 in size compared to the smallest one. The middle ellipse visibly corresponds best to the mask, (b) Typical line profile of a leaf structure. The velocity range of the structure is [υc−FWHM, υc+FWHM],
Current usage metrics show cumulative count of Article Views (full-text article views including HTML views, PDF and ePub downloads, according to the available data) and Abstracts Views on Vision4Press platform.
Data correspond to usage on the plateform after 2015. The current usage metrics is available 48-96 hours after online publication and is updated daily on week days.
Initial download of the metrics may take a while.