Fig. 11
Download original image
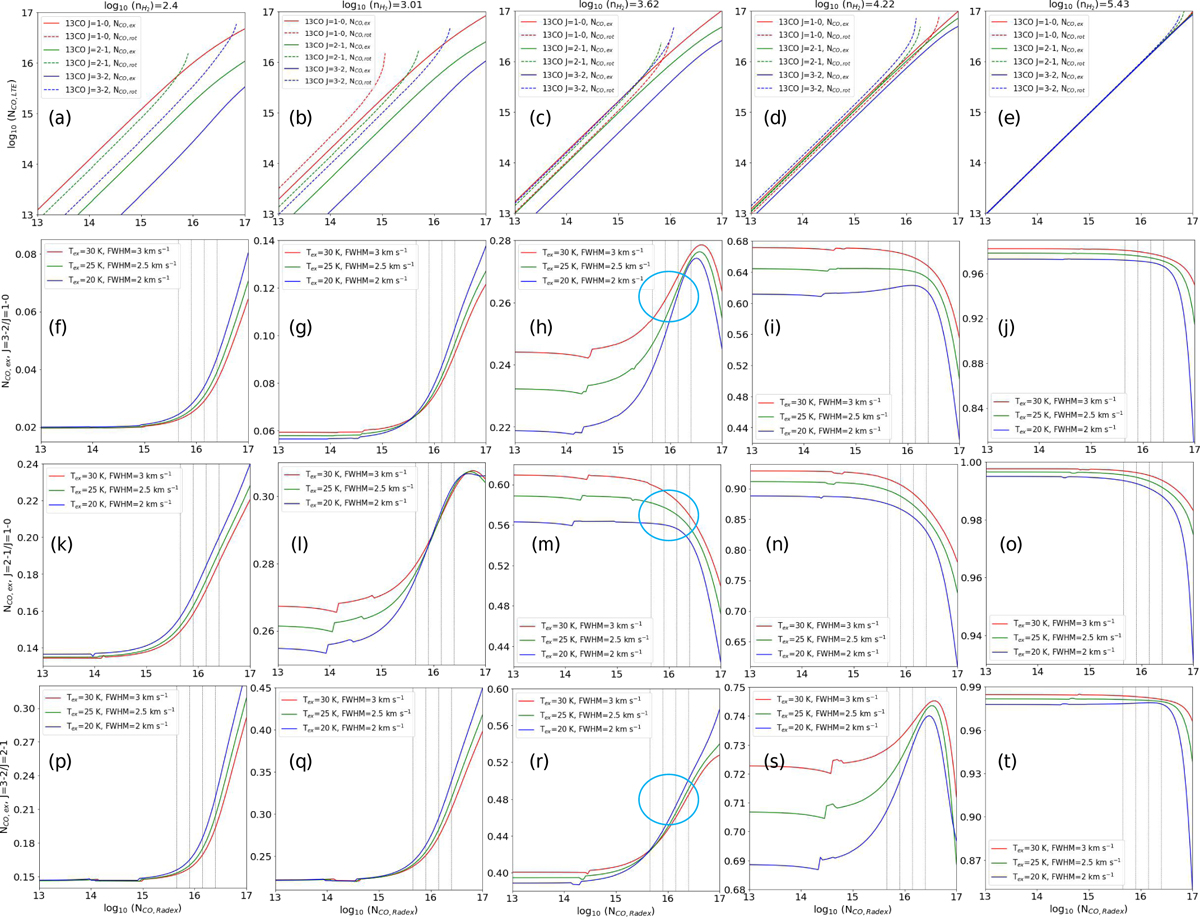
Calculation results of RADEX. First row: Correlation between RADEX input column densities and column densities of different 13CO transitions derived using LTE equations with Trot and Tex using TR computed by RADEX for different volume densities. Second, third, and fourth rows: Column density ratios of different 13CO transitions derived using LTE equations with Trot and Tex as a function of the RADEX column density input for different volume densities. Vertical lines mark the peak values of the 13CO column density derived from 13CO J = 3−2, J = 2−1, J = 1−0 and ATLASGAL+Planck 870 µm emission (from left to right) shown in Figs. 7−9; here the abundance ratio ![]() of H2 compared with 13CO ~ 7.1 × 10⁵ is used. Cyan circles mark the ratios predicted by RADEX when the input 13CO column density takes the peak values of the column density derived by different methods in Sect. 3.3.
of H2 compared with 13CO ~ 7.1 × 10⁵ is used. Cyan circles mark the ratios predicted by RADEX when the input 13CO column density takes the peak values of the column density derived by different methods in Sect. 3.3.
Current usage metrics show cumulative count of Article Views (full-text article views including HTML views, PDF and ePub downloads, according to the available data) and Abstracts Views on Vision4Press platform.
Data correspond to usage on the plateform after 2015. The current usage metrics is available 48-96 hours after online publication and is updated daily on week days.
Initial download of the metrics may take a while.