Open Access
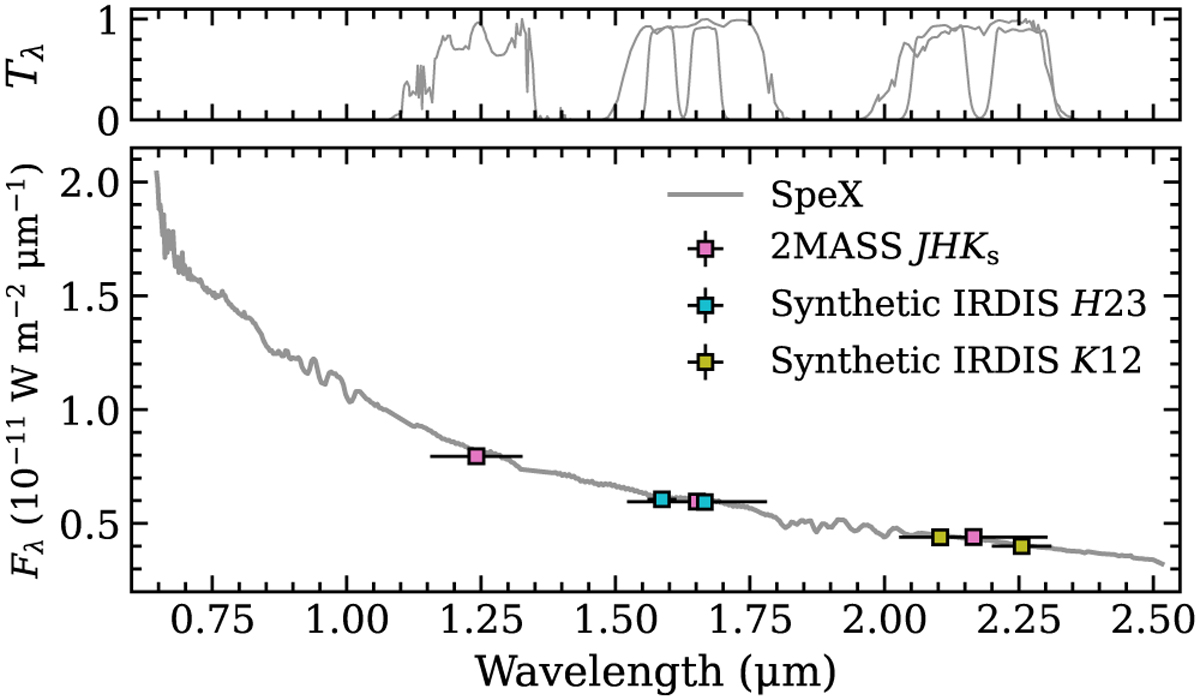
Fig. 2
Download original image
SpeX spectrum of HD 142527 at R ~ 75. The colored markers are the 2MASS JHKs fluxes and synthetic IRDIS H23 and K12 photometry. The horizontal error bars are the full width at half maximum of the filter transmission profiles, which are shown in the top panel.
Current usage metrics show cumulative count of Article Views (full-text article views including HTML views, PDF and ePub downloads, according to the available data) and Abstracts Views on Vision4Press platform.
Data correspond to usage on the plateform after 2015. The current usage metrics is available 48-96 hours after online publication and is updated daily on week days.
Initial download of the metrics may take a while.