Fig. 1
Download original image
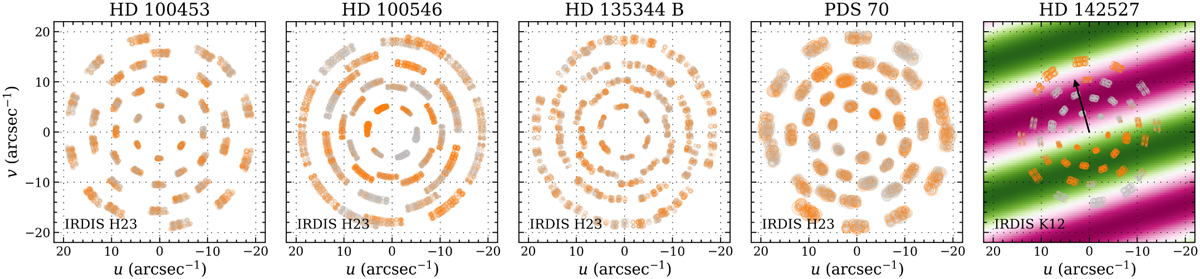
Coverage of the (u, v)-plane for the observations of HD 100453, HD 100546, HD 135344 B, PDS 70, and HD 142527 (from left to right), with K12 for HD 142527 and H23 for all other targets. The data points are shown with circular markers, with the shortest wavelength of the dual-band filters corresponding to the slightly larger baselines. The marker size gives an indication of the phase in the Fourier domain, while the orange and gray colors corresponds to a positive and negative sign of the phase, respectively. The background colors in the panel of HD 142527 show the phase pattern from the retrieved model parameters (see Sect. 4.1) and the arrow points in the direction of HD 142527 B.
Current usage metrics show cumulative count of Article Views (full-text article views including HTML views, PDF and ePub downloads, according to the available data) and Abstracts Views on Vision4Press platform.
Data correspond to usage on the plateform after 2015. The current usage metrics is available 48-96 hours after online publication and is updated daily on week days.
Initial download of the metrics may take a while.