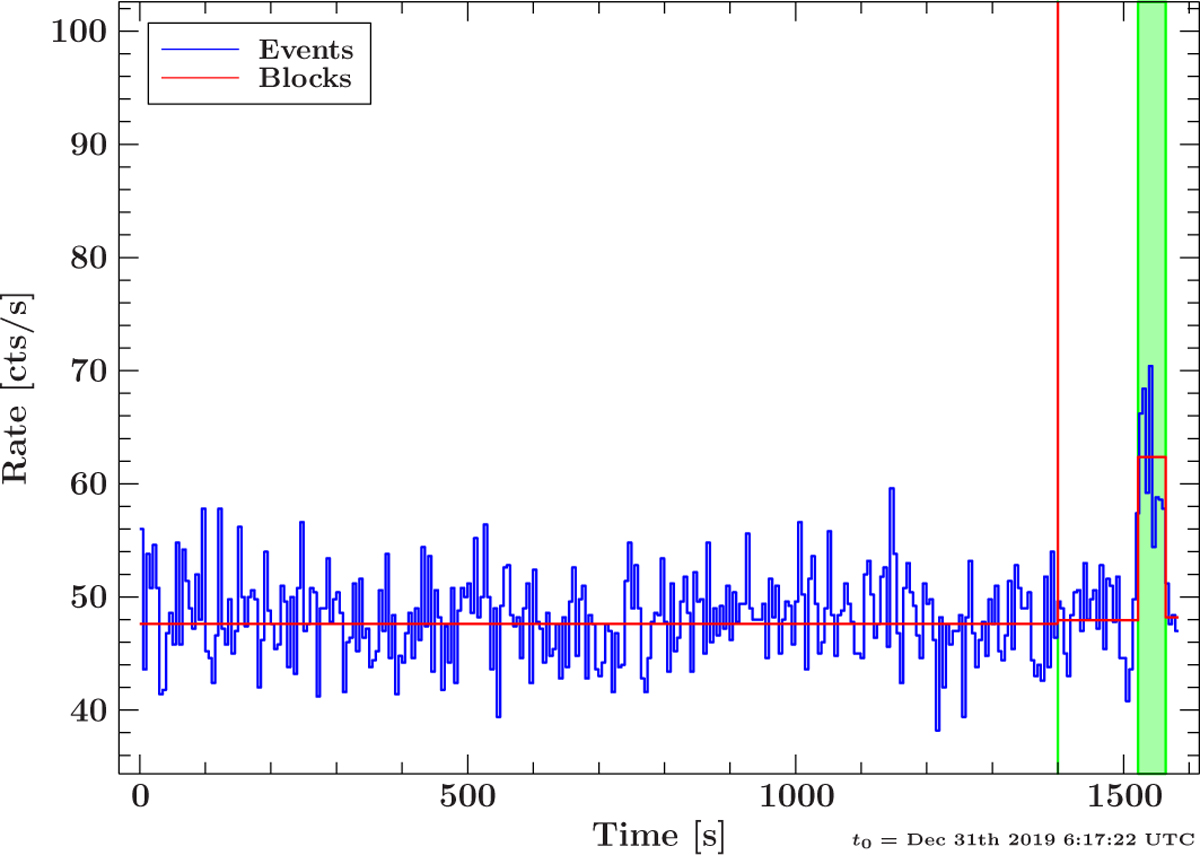
Fig. C.1
Download original image
Example detector light curve (blue) of TM 6 of one telemetry file with bins 5 s in length. The segmentation created by the Bayesian Blocks algorithm is shown in red and the identified intervals of bright sources in the field of view are shaded green. Note that the very short block at t ≈ 1400 s was caused by a remaining corrupt frame. The block of elevated count rate towards the end of the light curve was caused by an unknown transient X-ray source detected on New Year’s Eve 2019 (Wilms et al. 2020).
Current usage metrics show cumulative count of Article Views (full-text article views including HTML views, PDF and ePub downloads, according to the available data) and Abstracts Views on Vision4Press platform.
Data correspond to usage on the plateform after 2015. The current usage metrics is available 48-96 hours after online publication and is updated daily on week days.
Initial download of the metrics may take a while.