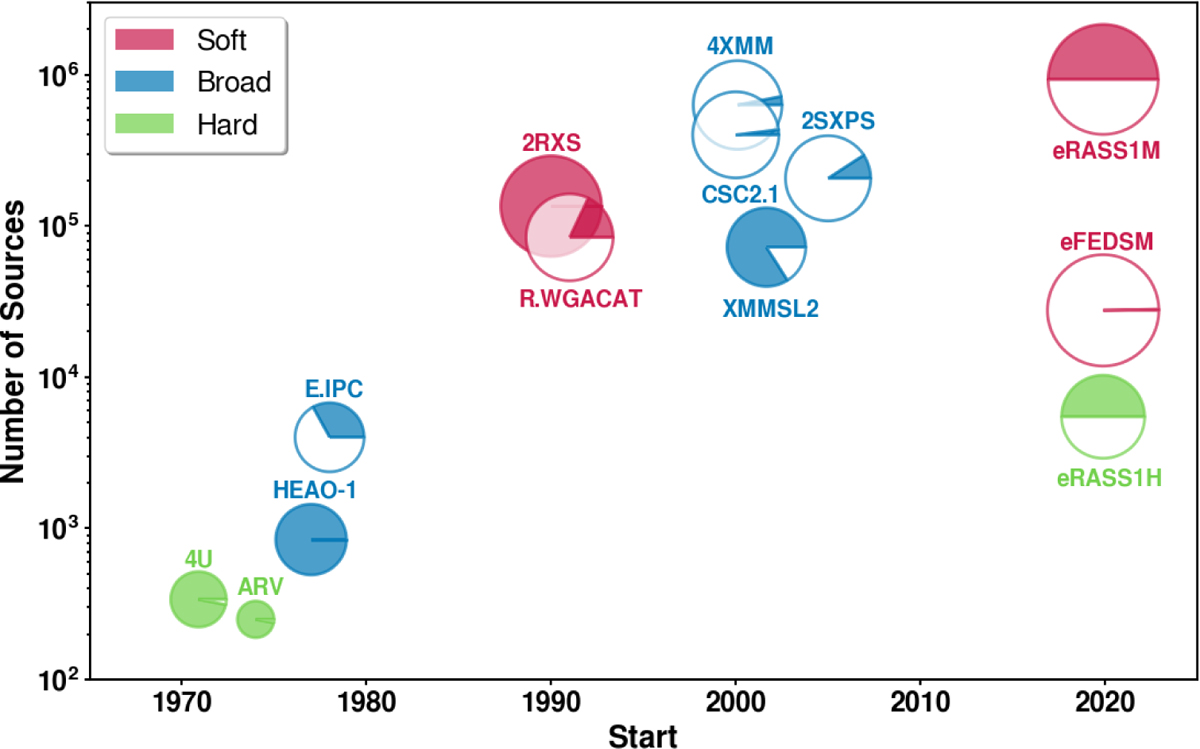
Fig. 18
Download original image
Graphical comparison of selected X-ray catalogs, based on the data presented in Table 9. For each catalogue we plot the total number of objects vs. the time of the start of the corresponding data-taking period. Each catalogue is represented by a circle, whose radius is proportional to the logarithm of the “discovery rate” (number of objects divided by the number of months of operations), while the shaded portion of the circle represents the fraction of the sky covered by the catalogue. The colour coding distinguishes telescopes operating mainly in the soft (<2.5 keV; red), hard (>2 keV; green) or broad (both soft and hard; blue) X-ray band. The datapoint corresponding to a putative 4XMM Hard catalog would sit very close to the full-band 4XMM one.
Current usage metrics show cumulative count of Article Views (full-text article views including HTML views, PDF and ePub downloads, according to the available data) and Abstracts Views on Vision4Press platform.
Data correspond to usage on the plateform after 2015. The current usage metrics is available 48-96 hours after online publication and is updated daily on week days.
Initial download of the metrics may take a while.