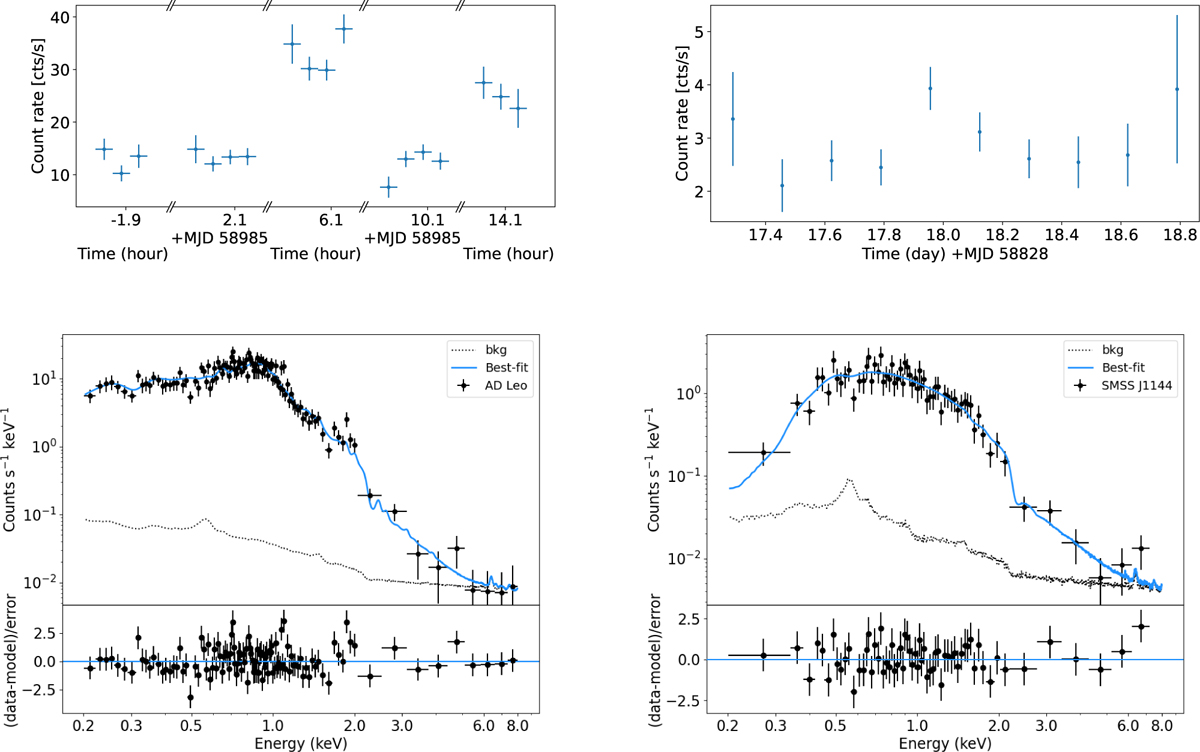
Fig. 17
Download original image
Two more examples of light curves (top panels) and spectra (bottom panels) for two sources contained in the eRASS1 Main catalogue, generated from the released source products. On the left hand side, we show the light curve and spectrum of the bright star AD Leo (1eRAsS J101935.6+195211; DETUID: em01_155069_020_ML00001_011_c010). The light curve (top left) is shown with the original 10s binning. The spectrum (bottom left) is fitted with a multi-temperature thermal collisionally-ionised plasma emission model (apec+apec+apec, with tied abundances). On the right hand side, we show the light curve and spectrum of SMSS J114447.770-430859.3, the most luminous QSO of the last 9 Gyr (Onken et al. 2022; Kammoun et al. 2023; 1eRASS J114447.6–430858; DETUID: em01_176132_020_ML00001_002_c010). The light curve (top right) is binned in individual eroday visits, while the spectrum (bottom right) is fitted with an absorbed power law. Note that both best-fit lines (light blue) are simple physical models aiming to guide the eye and do not intend to encompass all the potential detailed features present in the spectra. The background model is shown as black dotted lines in both figures. For more details on eROSITA spectral modelling and appropriate handling of background spectra, refer to Sect. 3 of Liu et al. (2022b).
Current usage metrics show cumulative count of Article Views (full-text article views including HTML views, PDF and ePub downloads, according to the available data) and Abstracts Views on Vision4Press platform.
Data correspond to usage on the plateform after 2015. The current usage metrics is available 48-96 hours after online publication and is updated daily on week days.
Initial download of the metrics may take a while.