Fig. 13
Download original image
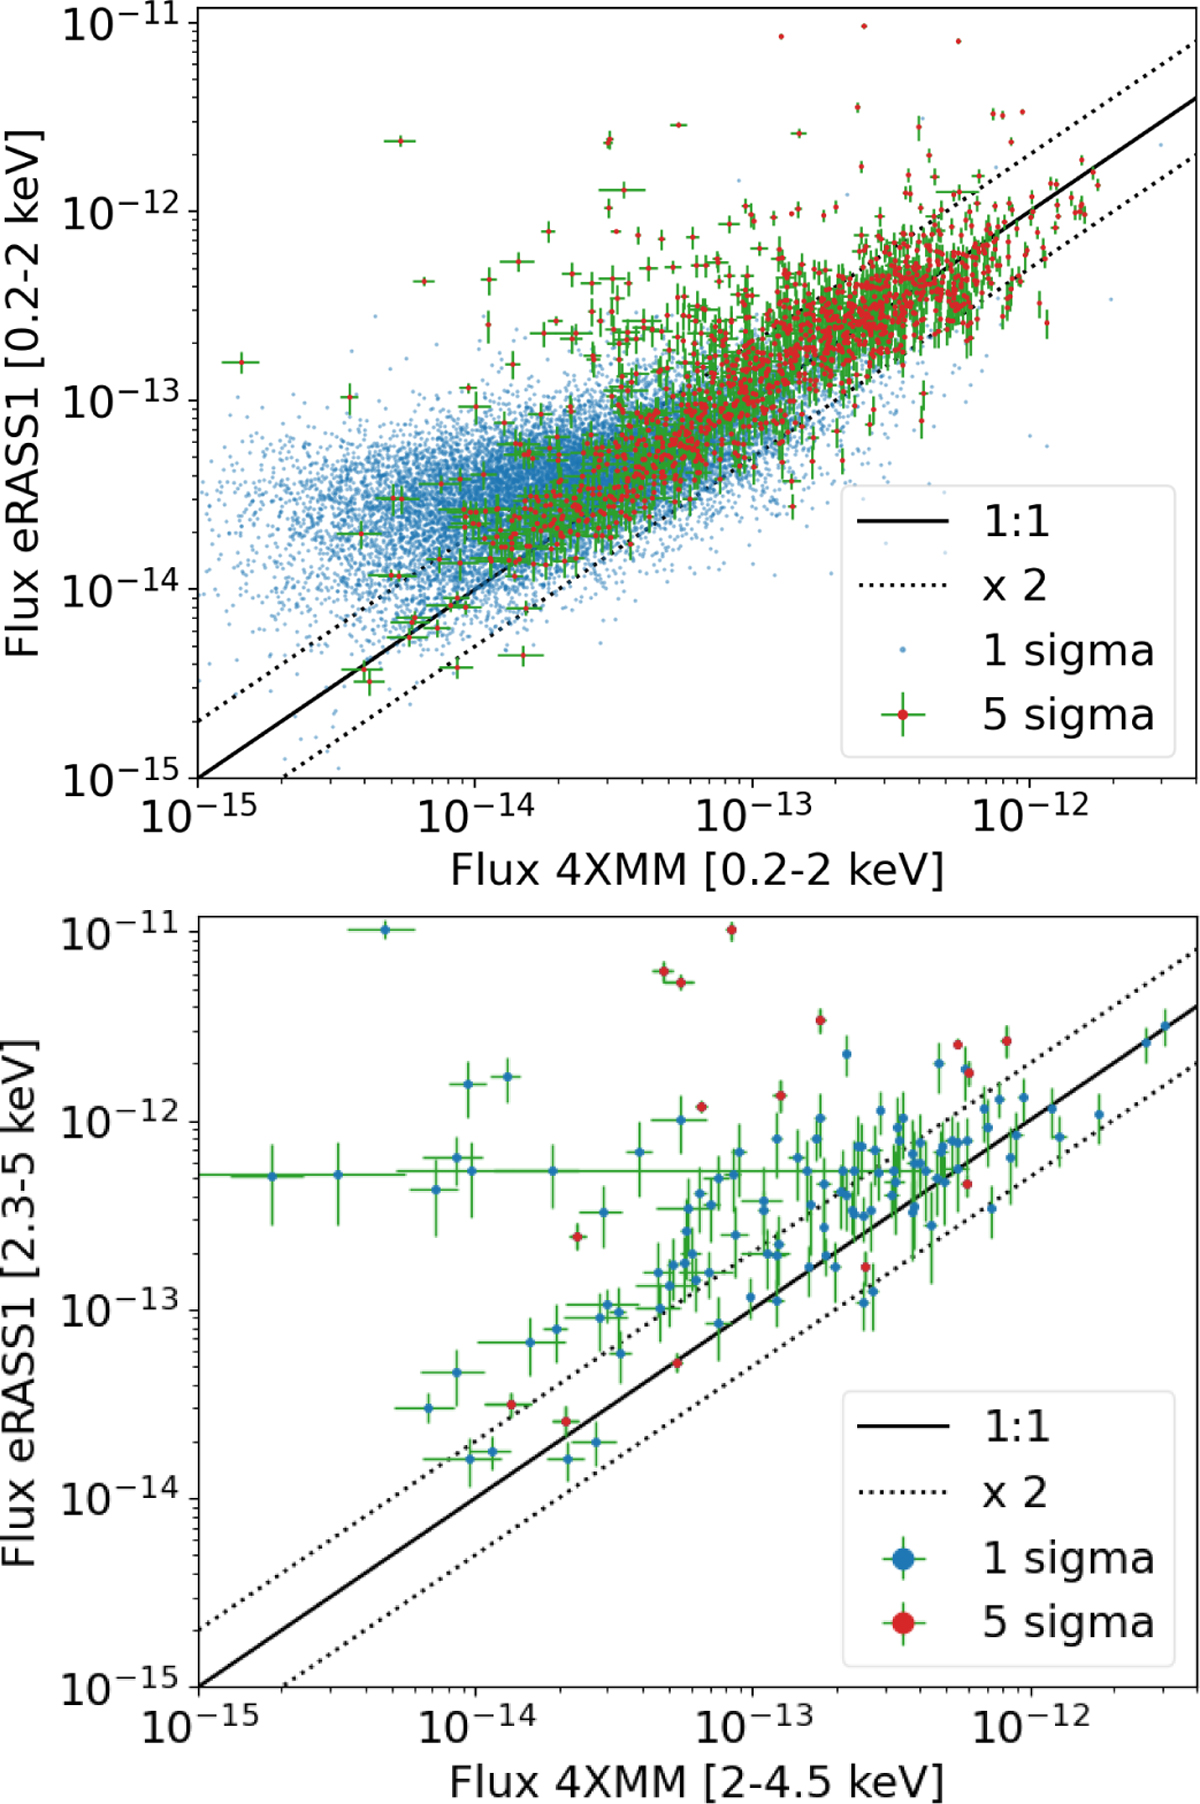
Flux comparison between eRASS1 and 4XMM catalogues. The upper panel displays the 0.2–2 keV fluxes of point sources. The brightest sources with at least 5σ flux measurements are plotted in red points with green 1-sigma uncertainties. The other sources are plotted in blue points without error bars. The black lines indicate 1:1 and deviation from 1:1 by a factor of 2. The lower panel shows a hard-band comparison for the Hard sources.
Current usage metrics show cumulative count of Article Views (full-text article views including HTML views, PDF and ePub downloads, according to the available data) and Abstracts Views on Vision4Press platform.
Data correspond to usage on the plateform after 2015. The current usage metrics is available 48-96 hours after online publication and is updated daily on week days.
Initial download of the metrics may take a while.