Fig. 11
Download original image
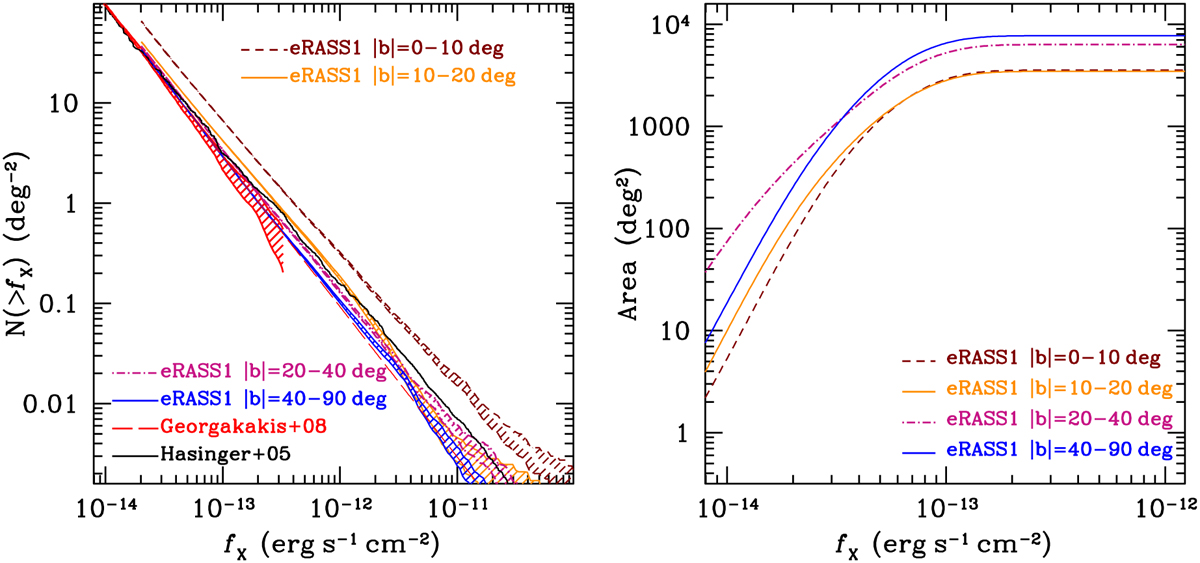
Left: cumulative number counts as a function of flux for eRASSl X-ray point sources selected in the 0.6–2.3 keV band. The apetool sensitivity maps and the eRASS1 aperture photometry for individual sources are used to construct the number counts in different Galactic latitude intervals, |b|=0−10° (brown dashed curves), 10−20° (yellow solid curves), 20−40° (purple dashed curves) and 40−90° (blue solid curves) following methods described in Georgakakis et al. (2008). The shaded region associated with each of these curves corresponds to the 68% uncertainty in the determination of number counts estimated using the bootstrap resampling method described in the text. The curves are plotted up to the flux of 2 × 10⁻¹⁴ erg s−1 cm−2 where the apetool sensitivity curve corresponds to about 1% of its maximum value. For comparison also shown are the 0.5–2 keV number counts determined by Hasinger et al. (2005, black solid line) using ROSAT, XMM-Newton and Chandra surveys. The red shaded region and red dashed curve are the 0.5–2 keV number counts estimated from Chandra extra-galactic survey fields (Georgakakis et al. 2008). The extent of the red shaded region at fixed flux corresponds to the 1σ uncertainty. For fluxes brighter than fX(0.5−2 keV) ≈ 10−12 erg s−1 cm−2 the red dashed curve is an extrapolation of the best-fit double power determined by Georgakakis et al. (2008). Right: the corresponding sensitivity curve, i.e. area coverage vs. flux limit in the 0.6–2.3 keV band, for different galactic latitude intervals.
Current usage metrics show cumulative count of Article Views (full-text article views including HTML views, PDF and ePub downloads, according to the available data) and Abstracts Views on Vision4Press platform.
Data correspond to usage on the plateform after 2015. The current usage metrics is available 48-96 hours after online publication and is updated daily on week days.
Initial download of the metrics may take a while.