Fig. 8
Download original image
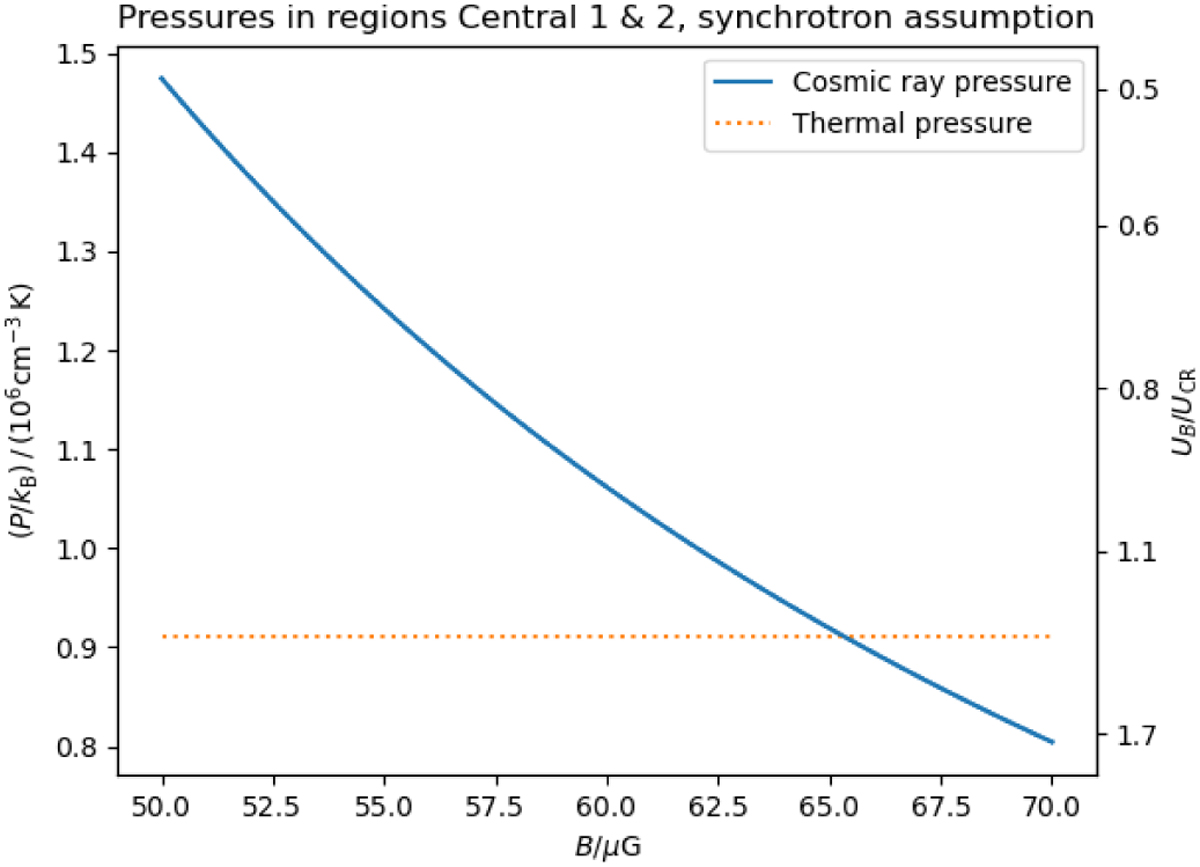
Possible cosmic-ray pressure in regions C1 and C2 under the assumption that the measured non-thermal X-ray radiation is synchrotron emission. The blue line shows the total cosmic-ray pressure (hadrons + leptons, left vertical axis) and the ratio of the magnetic and total cosmic-ray pressure (right vertical axis) over magnetic field strength. The magnetic field values we used are not observationally known, but are reasonable values given other observables of the region. The orange line shows the thermal pressure of the same region for comparison (left axis). See Sect. 5.4 for a discussion of this plot.
Current usage metrics show cumulative count of Article Views (full-text article views including HTML views, PDF and ePub downloads, according to the available data) and Abstracts Views on Vision4Press platform.
Data correspond to usage on the plateform after 2015. The current usage metrics is available 48-96 hours after online publication and is updated daily on week days.
Initial download of the metrics may take a while.