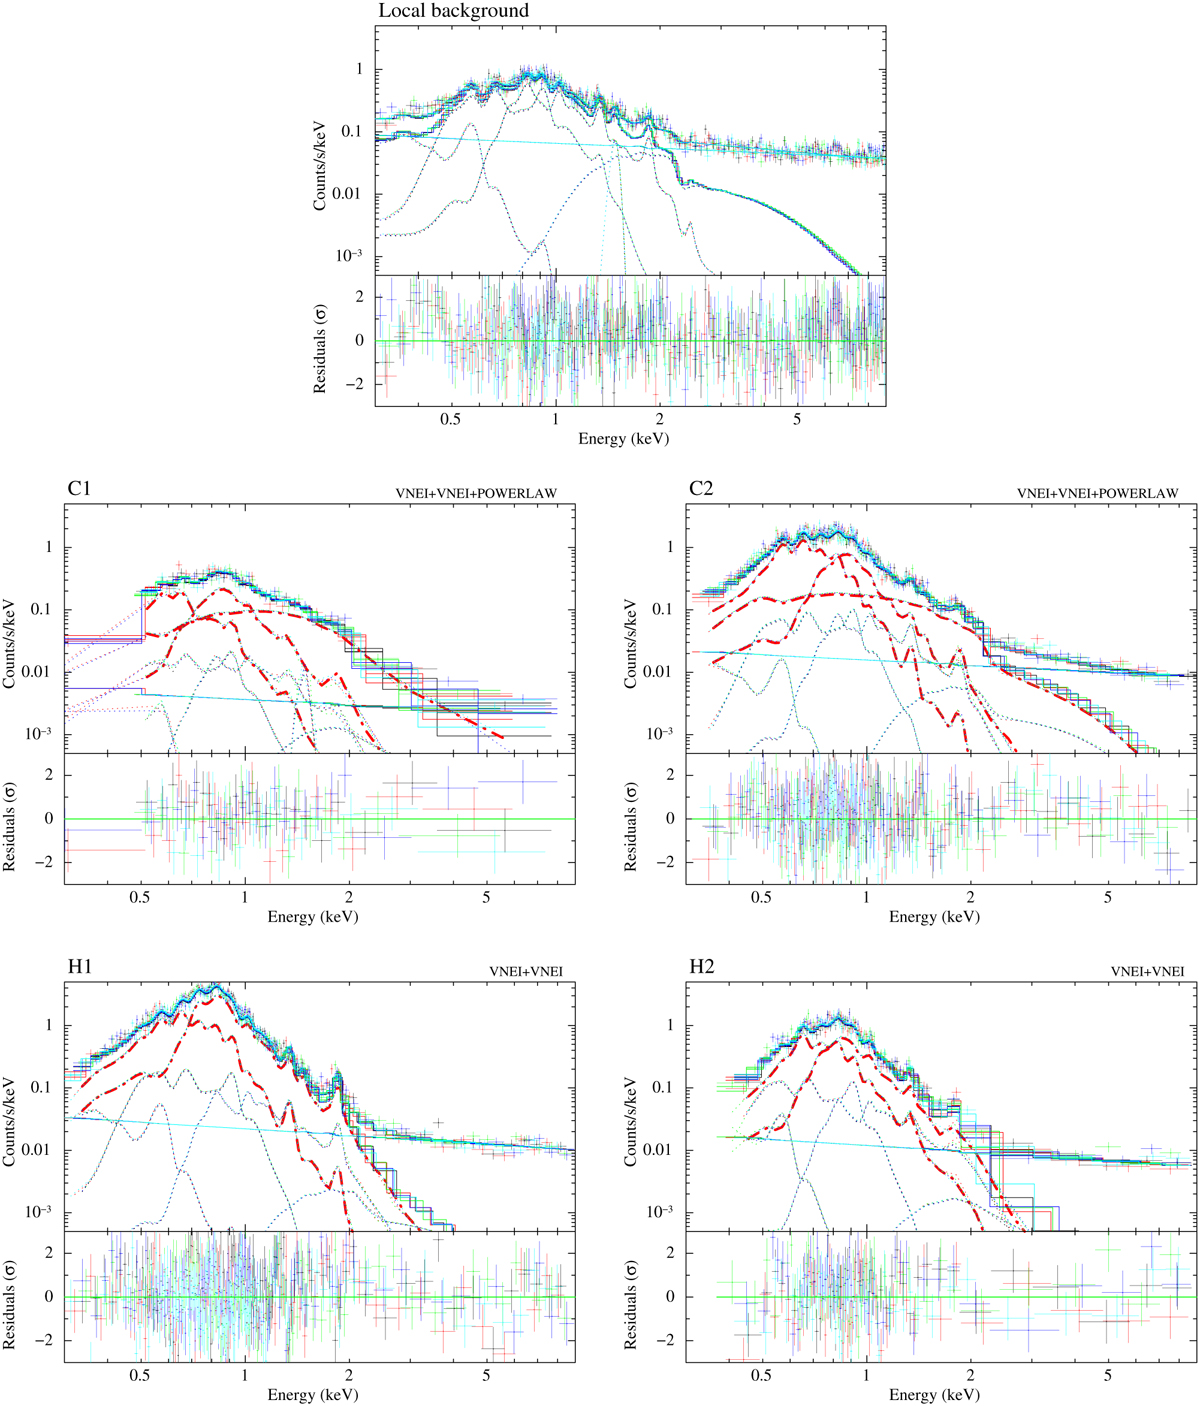
Fig. 3
Download original image
eROSITA TM1-4,6 spectra shown in black, red, green, blue, and cyan. For each TM, we show the spectral model components with the corresponding colours (the cyan lines are visible best) with dotted lines. The model also includes the particle background (seen as a straight line) and local X-ray background components. In addition, we mark the source components with thick dash-dotted red lines. The extraction regions are indicated in the upper left corner of each panel.
Current usage metrics show cumulative count of Article Views (full-text article views including HTML views, PDF and ePub downloads, according to the available data) and Abstracts Views on Vision4Press platform.
Data correspond to usage on the plateform after 2015. The current usage metrics is available 48-96 hours after online publication and is updated daily on week days.
Initial download of the metrics may take a while.