Fig. 2
Download original image
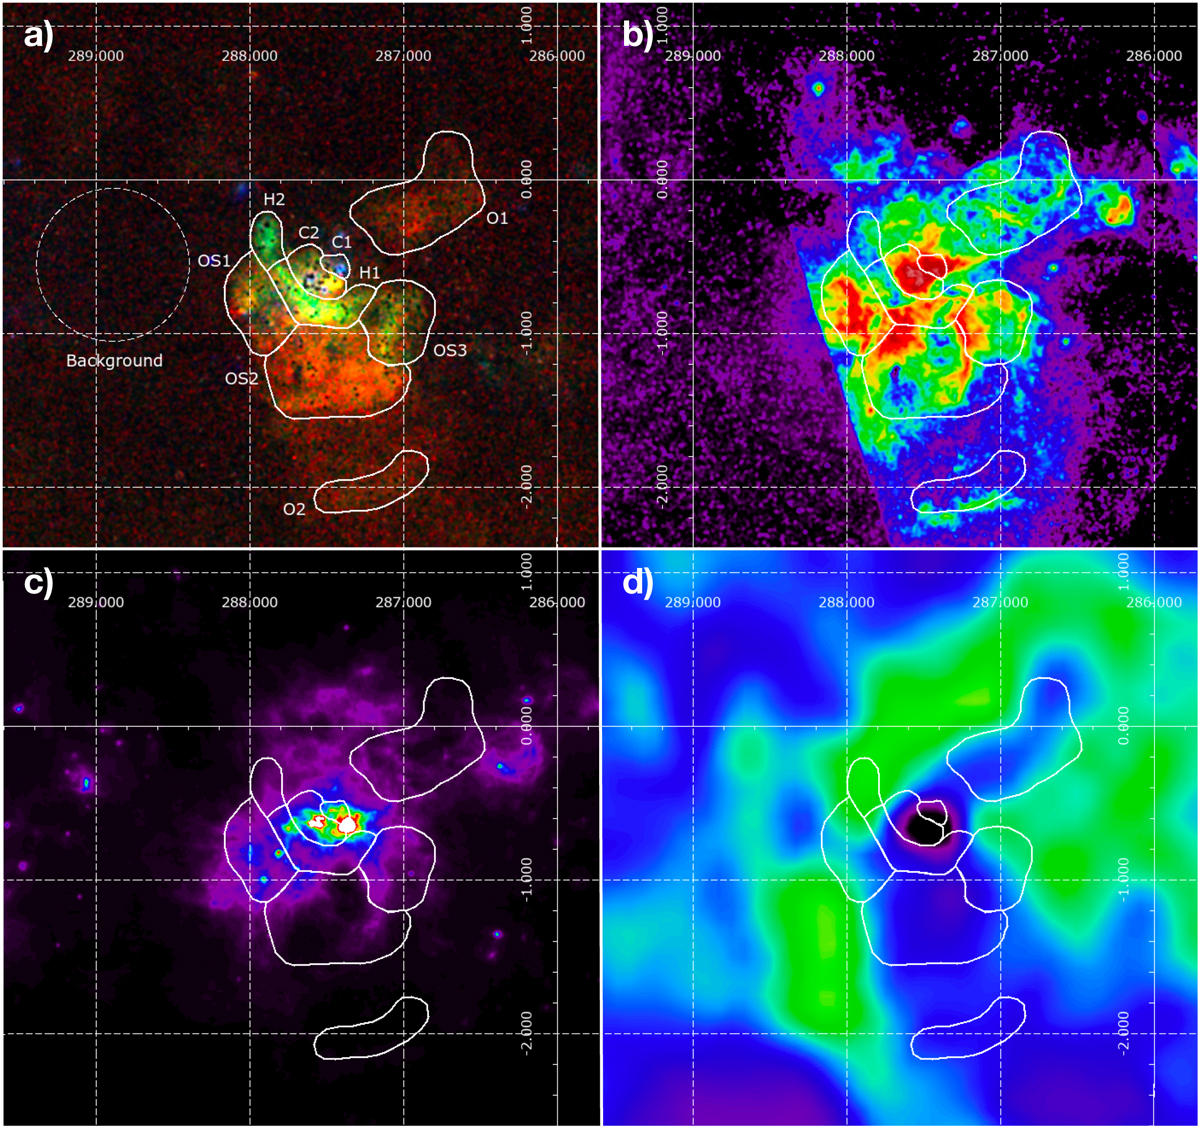
a) Exposure-corrected eROSITA three-colour image using point-source-free images of the three softer bands (red for 0.2–0.5 keV, green for 0.5–1.0 keV, and blue for 1.0–2.0 keV). b) Optical R-band image showing the mainly photoionised gas (2nd Digitized Sky Survey, R image, 6000–26 000 [arbitrary units]). c) IR image of cold dust with AKARI in the 60 µm band (Doi et al. 2015, 0–15 000 MJy sr−1). d) HI map of HI4PI survey (HI4PI Collaboration 2016, 0–1500), with the extraction regions for the spectral analysis shown in white. The labels are C1 for Central region 1, C2 for Central region 2, H1 for Hook region 1, H2 for Hook region 2, OS1 for Outskirt region 1, OS2 for Outskirt region 2, OS3 for Outskirt region 3, O1 for Outer region 1, and O2 for Outer region 2. The dashed circle shows the region from which the spectrum of the local background was extracted. All images are shown in Galactic coordinates using a linear intensity scale.
Current usage metrics show cumulative count of Article Views (full-text article views including HTML views, PDF and ePub downloads, according to the available data) and Abstracts Views on Vision4Press platform.
Data correspond to usage on the plateform after 2015. The current usage metrics is available 48-96 hours after online publication and is updated daily on week days.
Initial download of the metrics may take a while.