Fig. 4
Download original image
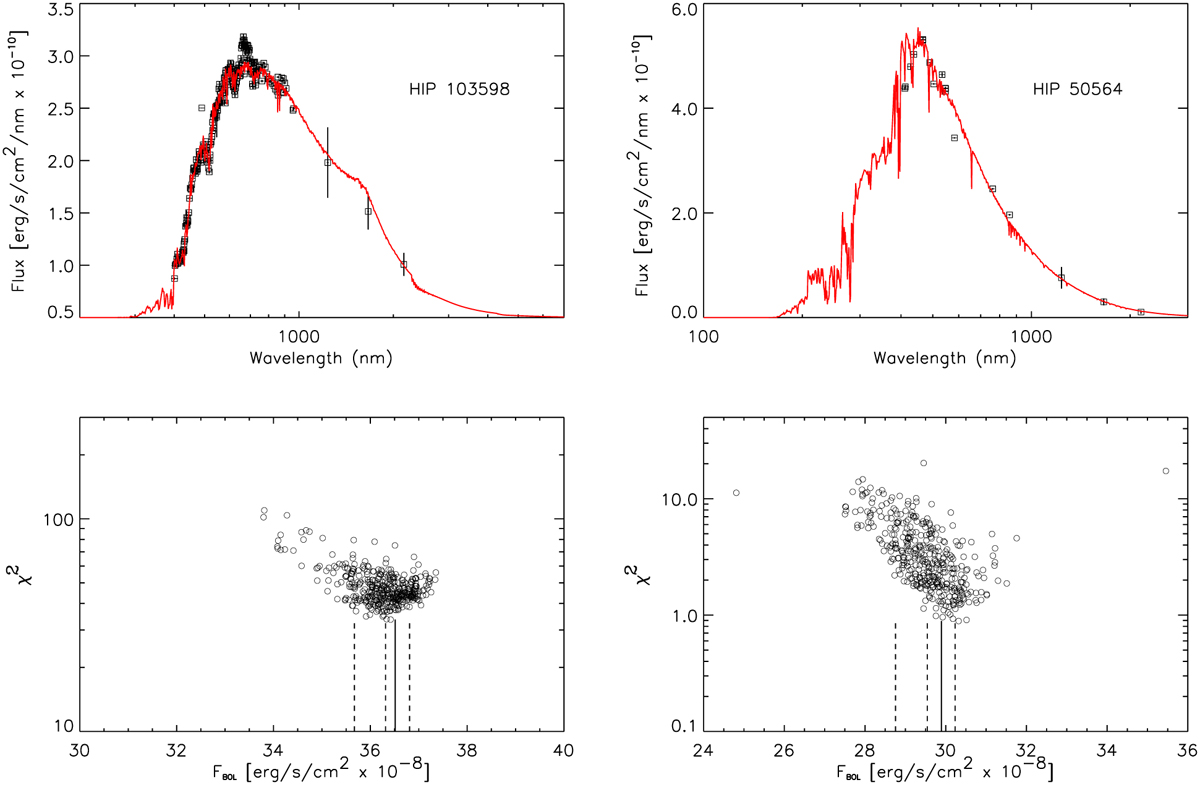
Example of fits of the observed (reddened) data to the (reddened) semi-empirical spectra for HIP 103598 (left) and HIP 50564 (right). The bolometric flux is calculated by integrating the un-reddened spectrum. The bottom panels illustrate the distribution of ![]() versus Fbol for the 400 simulations for the two stars with the 16th, 50th (median), and 84th percentiles indicated by the dashed lines. The continuous line is the derived Fbol without considering the simulations.
versus Fbol for the 400 simulations for the two stars with the 16th, 50th (median), and 84th percentiles indicated by the dashed lines. The continuous line is the derived Fbol without considering the simulations.
Current usage metrics show cumulative count of Article Views (full-text article views including HTML views, PDF and ePub downloads, according to the available data) and Abstracts Views on Vision4Press platform.
Data correspond to usage on the plateform after 2015. The current usage metrics is available 48-96 hours after online publication and is updated daily on week days.
Initial download of the metrics may take a while.