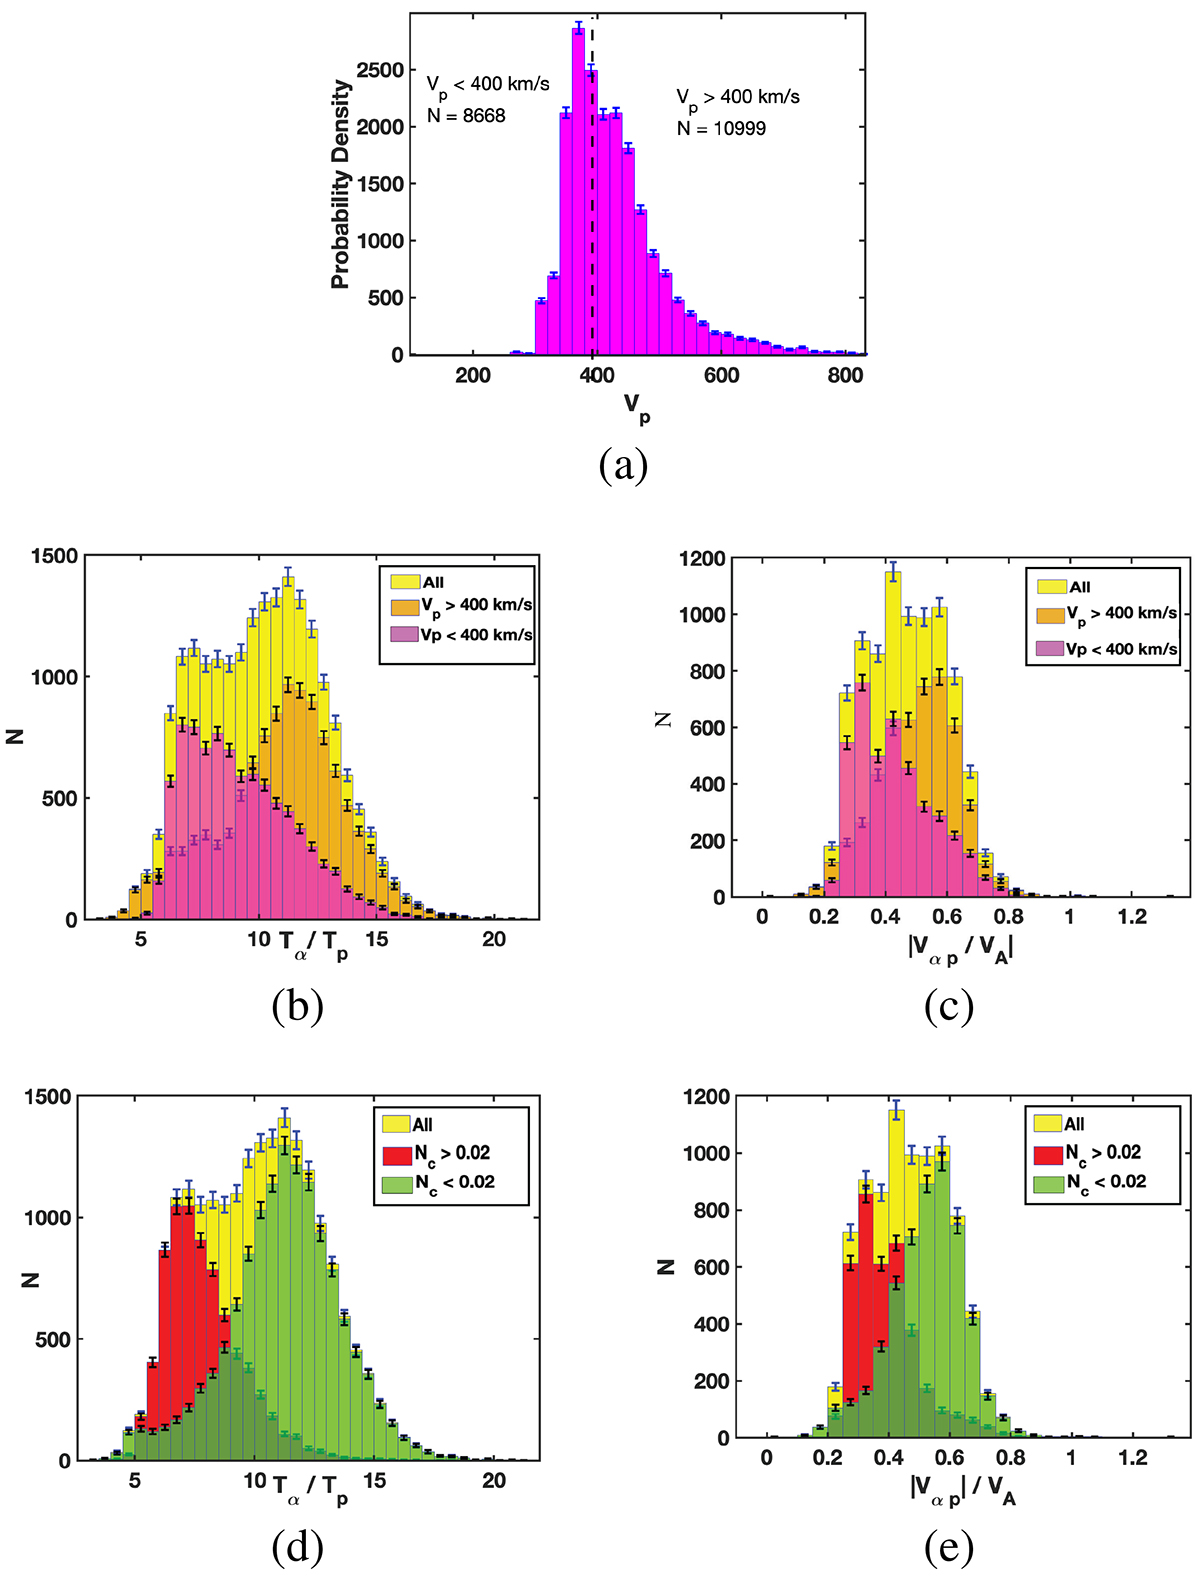
Fig. 2.
Download original image
Distribution of the temperature ratio and the differential velocity as a function of solar wind speed and collisional age. (a): Probability distribution of the proton velocity shows that our dataset during encounter 10 includes a similar amount of fast and slow solar wind with velocities greater and smaller than 400 km s−1, respectively. (b): Distribution of Tα/Tp for different solar wind speeds. Yellow, pink, and orange shaded regions show the Tα/Tp of the combined, slow and fast solar wind, respectively. (d): Distribution of Tα/Tp for all, small, and large Coulomb numbers are shown in yellow, red, and green shaded regions, respectively. The distribution of differential velocity over Alfvén speed is plotted based on different solar wind speeds and Coulomb numbers in panels c and e. Error bars are shown in all panels.
Current usage metrics show cumulative count of Article Views (full-text article views including HTML views, PDF and ePub downloads, according to the available data) and Abstracts Views on Vision4Press platform.
Data correspond to usage on the plateform after 2015. The current usage metrics is available 48-96 hours after online publication and is updated daily on week days.
Initial download of the metrics may take a while.