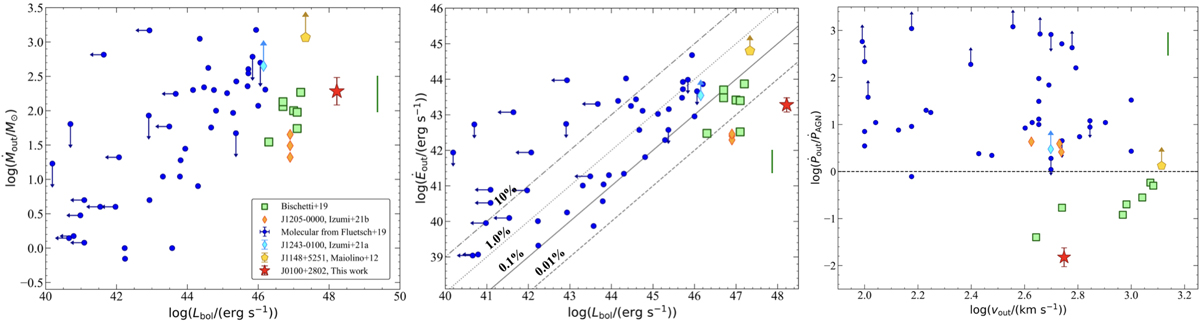
Fig. 7.
Download original image
Energetics for the outflow in J0100+2802 (a red star) compared with different stacked spectra (hollow green squares, see legend; Bischetti et al. 2019a), [CII] outflows in QSO J1148+5251 at z = 6.42 (gold pentagon, Maiolino et al. 2012) and in two QSOs at z = 6.7 and z = 7.07 belonging to the Subaru High-z Exploration of Low-luminosity Quasars (SHELLQs) sample (diamonds, Izumi et al. 2021a,b), and molecular outflows in a sample of low-z AGNs (blue dots, Fluetsch et al. 2019). Left panel: mass outflow rate as a function of the bolometric luminosity. The typical ∼0.3dex uncertainty on the outflow rate found in the sample of Bischetti et al. (2019a) is shown by the vertical green line. The error bars associated with the red stars mark the lower and upper limits found for J0100+2802, reported in Table 3. Central panel: Kinetic power as a function of the bolometric luminosity. The dot-dashed, dotted, solid, and dashed lines indicate kinetic powers that are 10%, 1%, 0.1%, and 0.01% of the bolometric luminosity. Right panel: momentum load factor as a function of the outflow velocity. The horizontal line corresponds to Ṗout = ṖAGN.
Current usage metrics show cumulative count of Article Views (full-text article views including HTML views, PDF and ePub downloads, according to the available data) and Abstracts Views on Vision4Press platform.
Data correspond to usage on the plateform after 2015. The current usage metrics is available 48-96 hours after online publication and is updated daily on week days.
Initial download of the metrics may take a while.