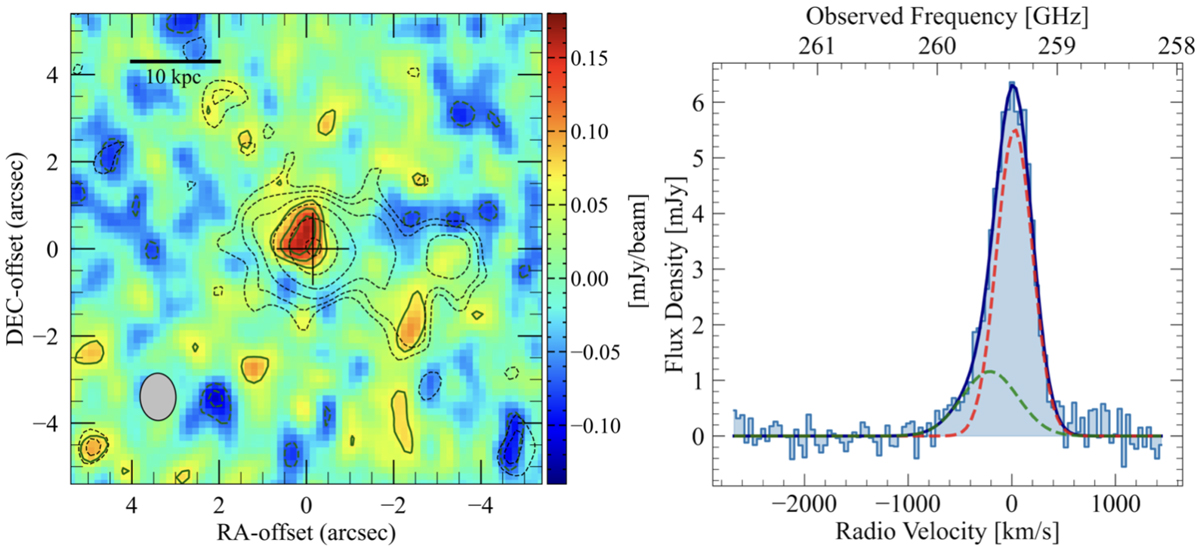
Fig. 6.
Download original image
Outflow map and optimized [CII] spectrum. Left panel: [CII] outflow map made with v = [−500,−1000] km s−1 with green contours at −3, −2, 2, 3, and 4σ, with σ = 0.034 mJy beam−1, and dashed black contours from the full [CII] map, as in the top left panel of Fig. 2. Right panel: the [CII] spectrum was extracted from a central region of 1.2 arcsec radius and binned at 40 km s−1. The solid blue line is the total fit, composed of two Gaussian components (narrow, as a dashed red line; broad, as a dashed green line). The broad component is associated with an outflowing emission.
Current usage metrics show cumulative count of Article Views (full-text article views including HTML views, PDF and ePub downloads, according to the available data) and Abstracts Views on Vision4Press platform.
Data correspond to usage on the plateform after 2015. The current usage metrics is available 48-96 hours after online publication and is updated daily on week days.
Initial download of the metrics may take a while.