Fig. 4.
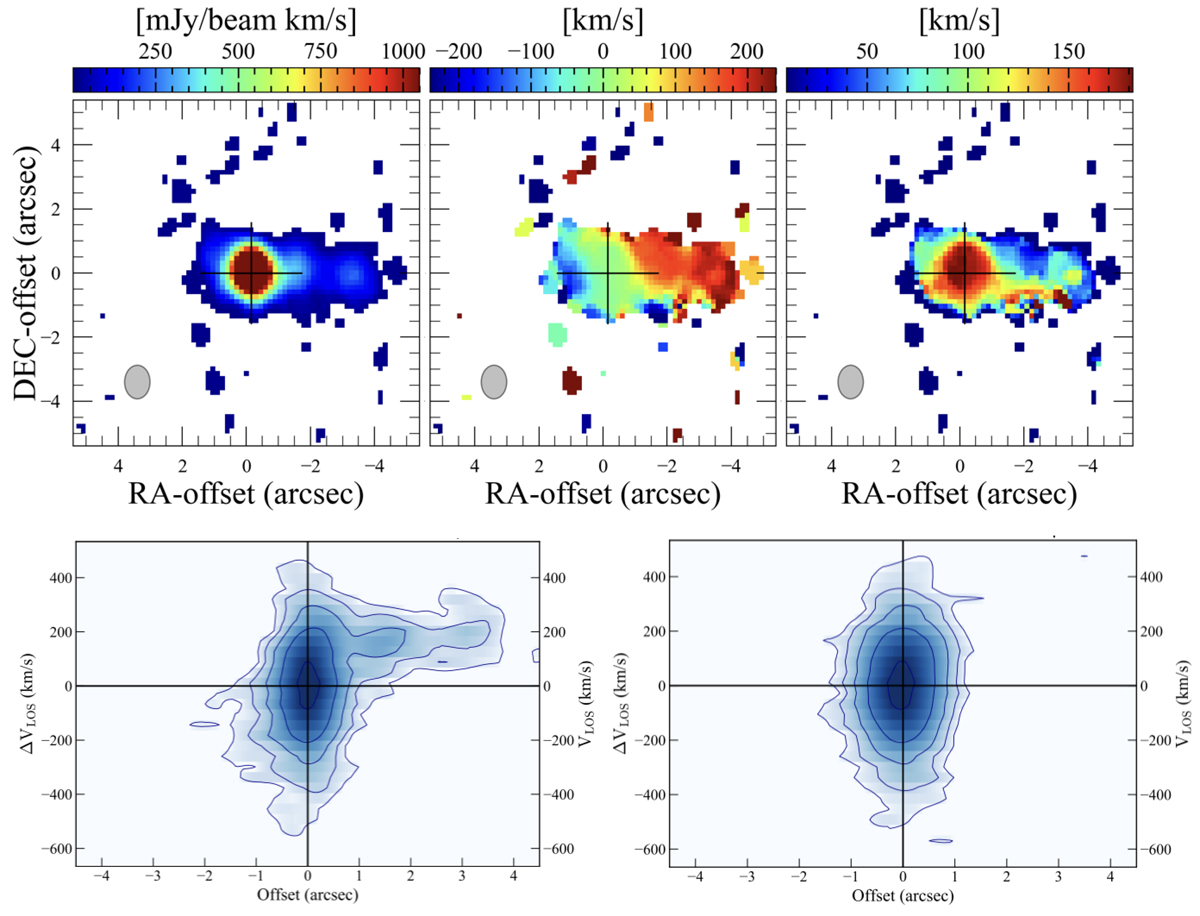
Download original image
Moment maps and PV diagram of the [CII] emission line. Top panel: integrated flux, mean velocity map, velocity dispersion map, and continuum-subtracted spectrum of [CII]. The clean beam is plotted in the lower left corner of the moment maps. The cross indicates the peak position of the integrated flux. Bottom panel: PV diagrams of the [CII] emission line along the line of nodes (PA = 275°) and orthogonal to it (PA = 185°).
Current usage metrics show cumulative count of Article Views (full-text article views including HTML views, PDF and ePub downloads, according to the available data) and Abstracts Views on Vision4Press platform.
Data correspond to usage on the plateform after 2015. The current usage metrics is available 48-96 hours after online publication and is updated daily on week days.
Initial download of the metrics may take a while.