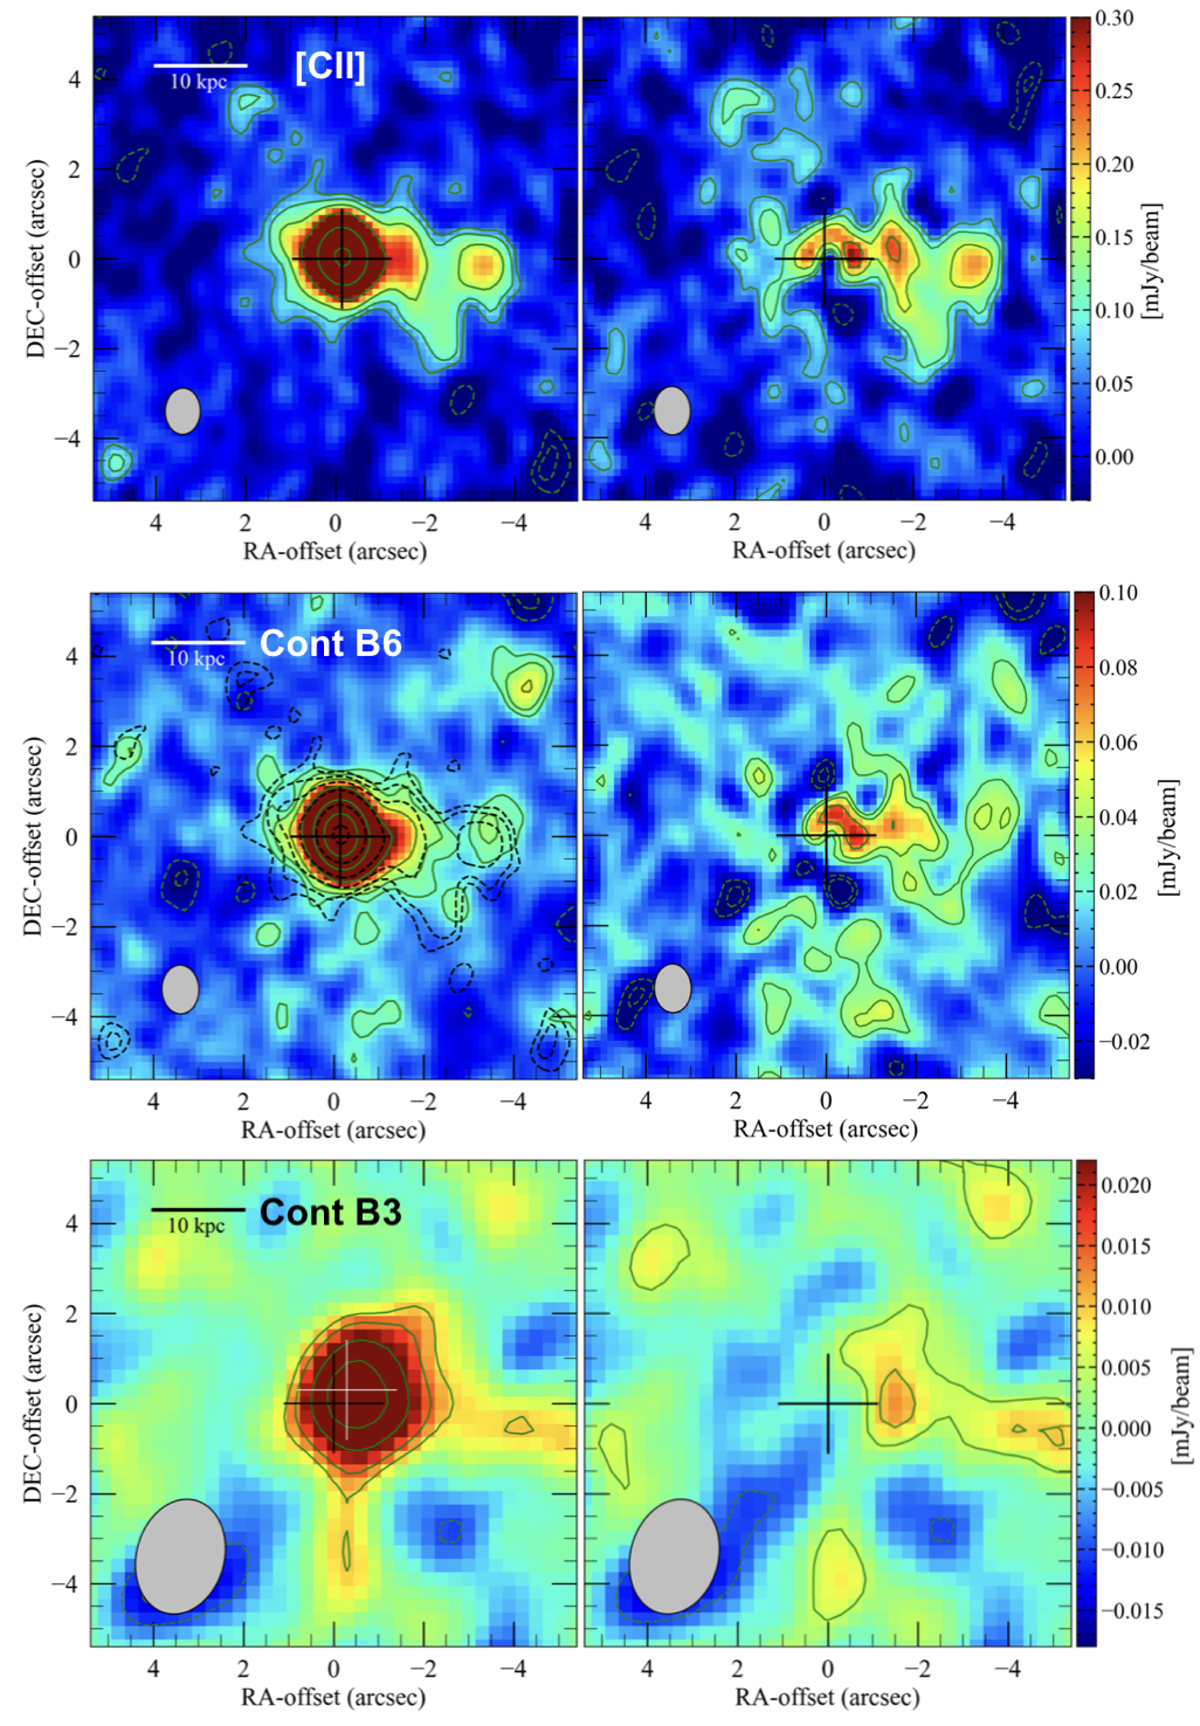
Fig. 2.
Download original image
[CII] and continuum maps of J0100+2802. In each panel, the clean beam is plotted in the lower left corner and the cross indicates the peak position of the QSO continuum in band 6. Top panels: [CII] map with green contours at −3, −2, 2, 3, 5, 10, 25, and 50σ, with σ = 0.03 mJy beam−1 (left). PSF-subtracted [CII] map with green contours at −3, −2, 2, 3, and 5σ, with σ = 0.03 mJy beam−1 (right). Central panels: continuum map in band 6 with green contours at −3, −2, 2, 3, 5, 10, 25, and 50σ, with σ = 0.01 mJy beam−1 (left). [CII] contours are overplotted as a dashed black line at −3, −2, 2, 3, 5, 10, 25, and 50σ, with σ = 0.03 mJy beam−1. PSF-subtracted continuum map with green contours at −3, −2, 2, 3, and 5σ, with σ = 0.01 mJy beam−1 (right). Bottom panels: continuum map in band 3 with green contours at −3, −2, 2, 3, 5, and 7σ, with σ = 0.005 mJy beam−1 (left). PSF-subtracted continuum map with green contours at −3, −2, 2, and 3σ, with σ = 0.005 mJy beam−1 (right). The white cross marks the peak of the continuum in band 3.
Current usage metrics show cumulative count of Article Views (full-text article views including HTML views, PDF and ePub downloads, according to the available data) and Abstracts Views on Vision4Press platform.
Data correspond to usage on the plateform after 2015. The current usage metrics is available 48-96 hours after online publication and is updated daily on week days.
Initial download of the metrics may take a while.