Open Access
Fig. 1.
Download original image
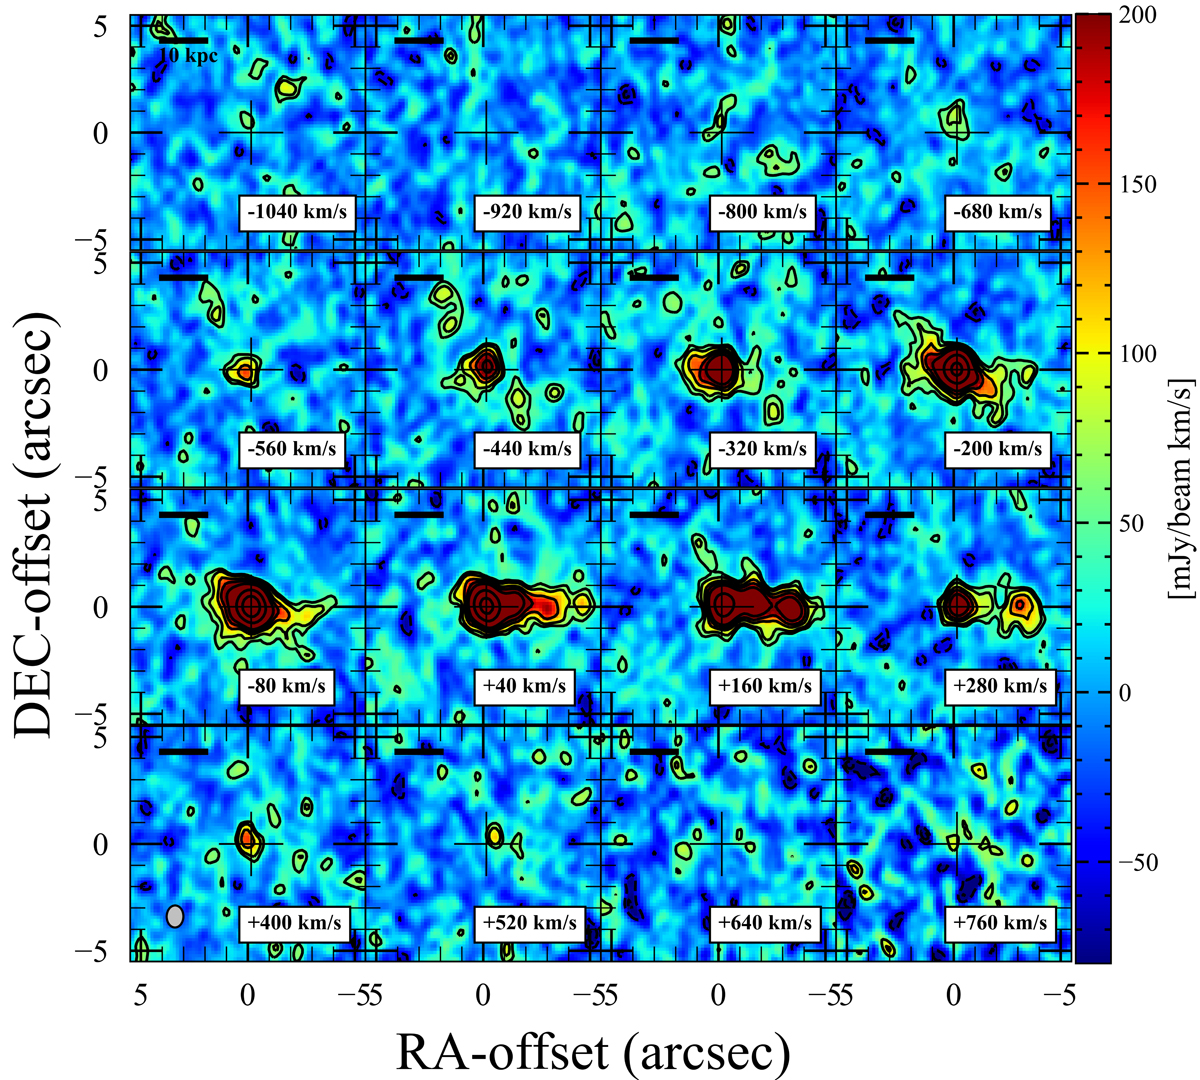
Channel maps of the [CII] emission line for J0100+2802. The cross indicates the peak position of the continuum and velocities are relative to the redshift of the [CII], as determined in Wang et al. (2019). Contours are at −3, −2, 2, 3, 5, 7, 10, 25, and 50σ. The clean beam is shown in the inset in the lower left corner.
Current usage metrics show cumulative count of Article Views (full-text article views including HTML views, PDF and ePub downloads, according to the available data) and Abstracts Views on Vision4Press platform.
Data correspond to usage on the plateform after 2015. The current usage metrics is available 48-96 hours after online publication and is updated daily on week days.
Initial download of the metrics may take a while.