Open Access
Fig. 9
Download original image
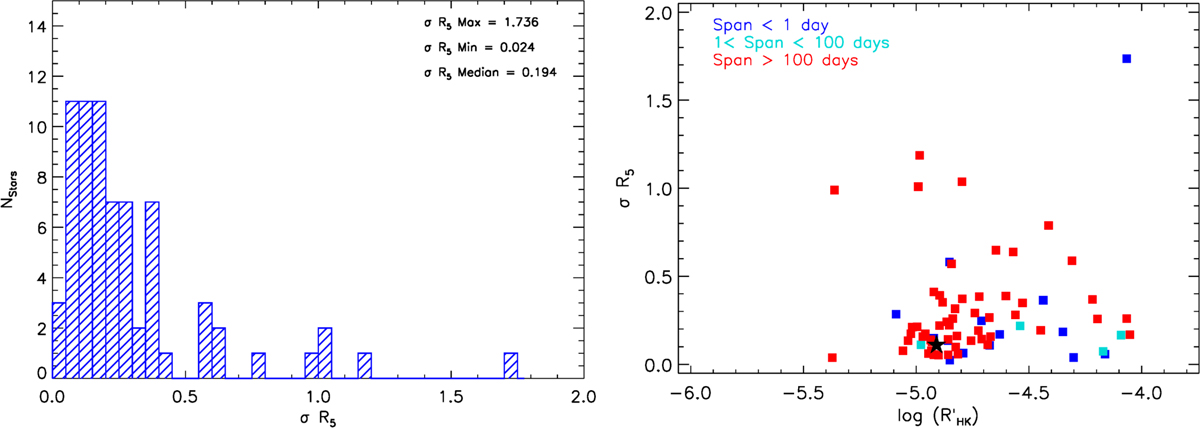
Standard deviation ofσR5 for the GAPS transiting planet hosts:. Left panel: distribution of σR5. Right panel: standard deviation of R5 versus the ![]() for the GAPS stars. The different colors indicate the time baselines of the measurements as reported in the legend. The position of the Sun is marked with a black star.
for the GAPS stars. The different colors indicate the time baselines of the measurements as reported in the legend. The position of the Sun is marked with a black star.
Current usage metrics show cumulative count of Article Views (full-text article views including HTML views, PDF and ePub downloads, according to the available data) and Abstracts Views on Vision4Press platform.
Data correspond to usage on the plateform after 2015. The current usage metrics is available 48-96 hours after online publication and is updated daily on week days.
Initial download of the metrics may take a while.