Fig. 15
Download original image
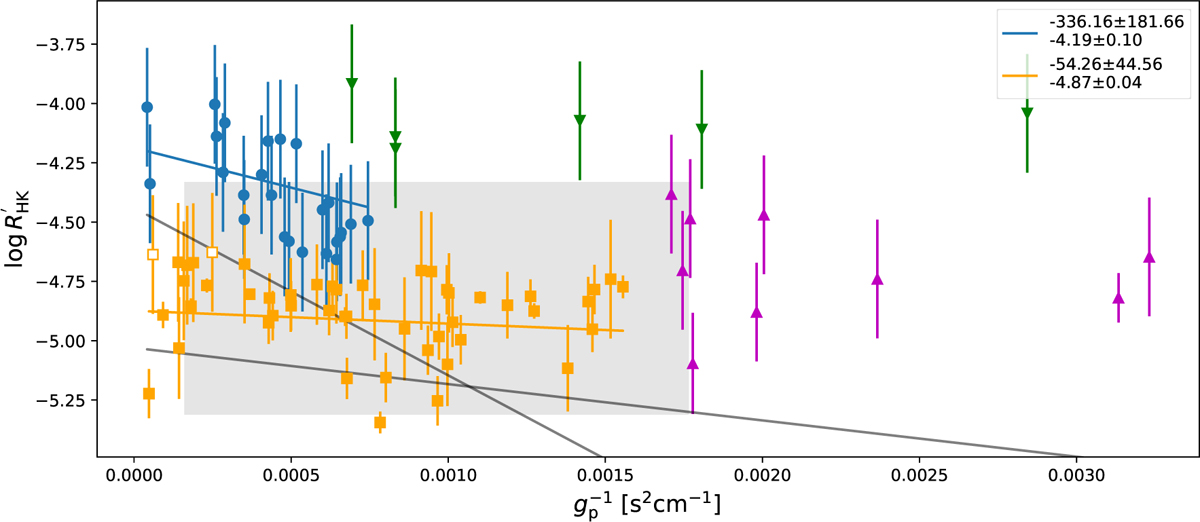
Clustering in the ![]() space provided by our decision tree implementation. Each cluster is represented by a different color and marker. Linear fits of
space provided by our decision tree implementation. Each cluster is represented by a different color and marker. Linear fits of ![]() as a function of
as a function of ![]() , as discussed in the text, are also shown. The portion of parameter space and the linear relationships found by Fossati et al. (2015) are shown with the gray region and black lines, respectively.
, as discussed in the text, are also shown. The portion of parameter space and the linear relationships found by Fossati et al. (2015) are shown with the gray region and black lines, respectively.
Current usage metrics show cumulative count of Article Views (full-text article views including HTML views, PDF and ePub downloads, according to the available data) and Abstracts Views on Vision4Press platform.
Data correspond to usage on the plateform after 2015. The current usage metrics is available 48-96 hours after online publication and is updated daily on week days.
Initial download of the metrics may take a while.