Fig. 12
Download original image
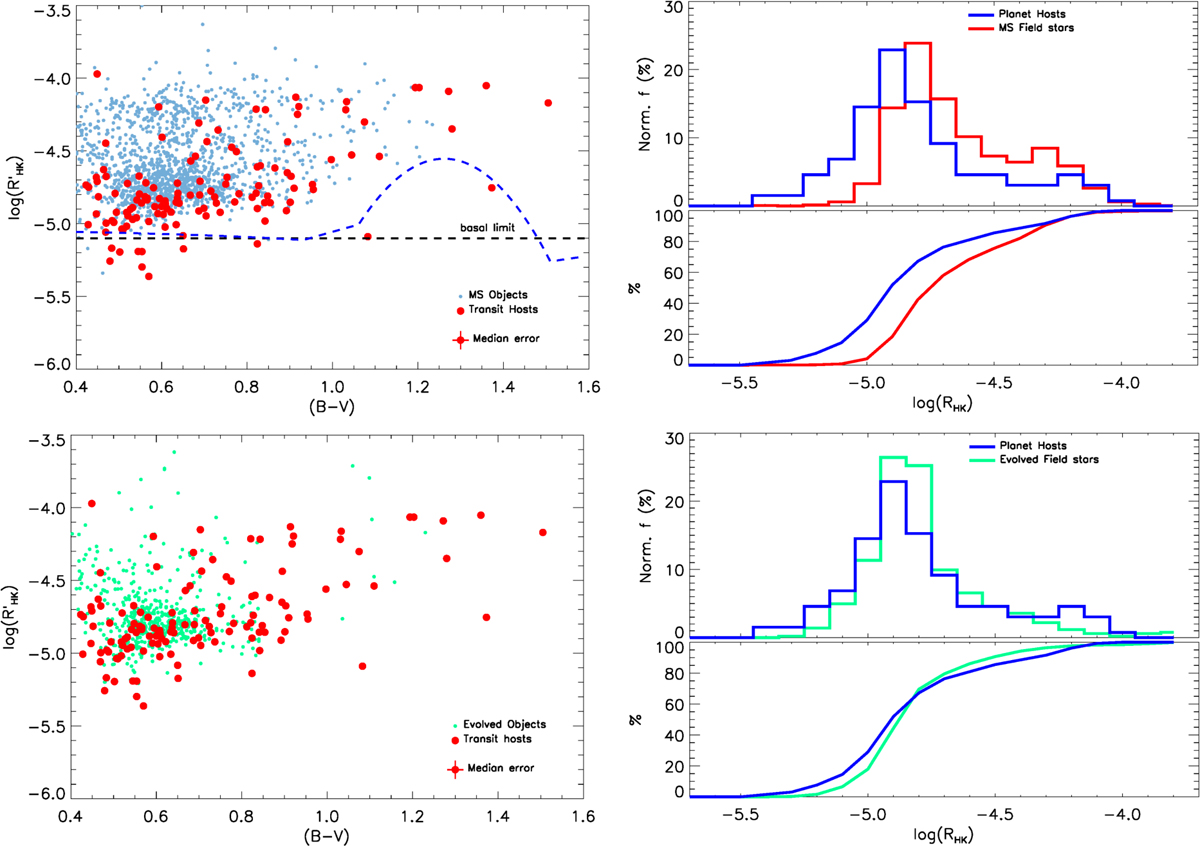
Comparison of the CA of host stars with the CA of MS and evolved stars. Top panel: distribution of the MS-field stars with ∆MV ≤ 0.45 above the average HIPPARCOS MS (cyano small filled circles) and the transiting planet hosts (left). In the plot, we also indicated two representations of the activity basal limit for MS stars. The black dashed line is the generally considered constant limit. The blue dashed line is the polynomial model of the basal level (Mittag et al. 2013). The comparison of the normalized histograms and the cumulative distribution functions of the two distributions in the left panel (right). Bottom panel: evolved field stars with 0.45 ≤ ∆MV ≤ 2.00 above the average Hypparcos MS (small filled green circles) and the transiting planet hosts (of both samples) are on the left. A comparison of the normalized histograms and the cumulative distribution functions of the two distributions in the left panel is on the right.
Current usage metrics show cumulative count of Article Views (full-text article views including HTML views, PDF and ePub downloads, according to the available data) and Abstracts Views on Vision4Press platform.
Data correspond to usage on the plateform after 2015. The current usage metrics is available 48-96 hours after online publication and is updated daily on week days.
Initial download of the metrics may take a while.