Fig. 6.
Download original image
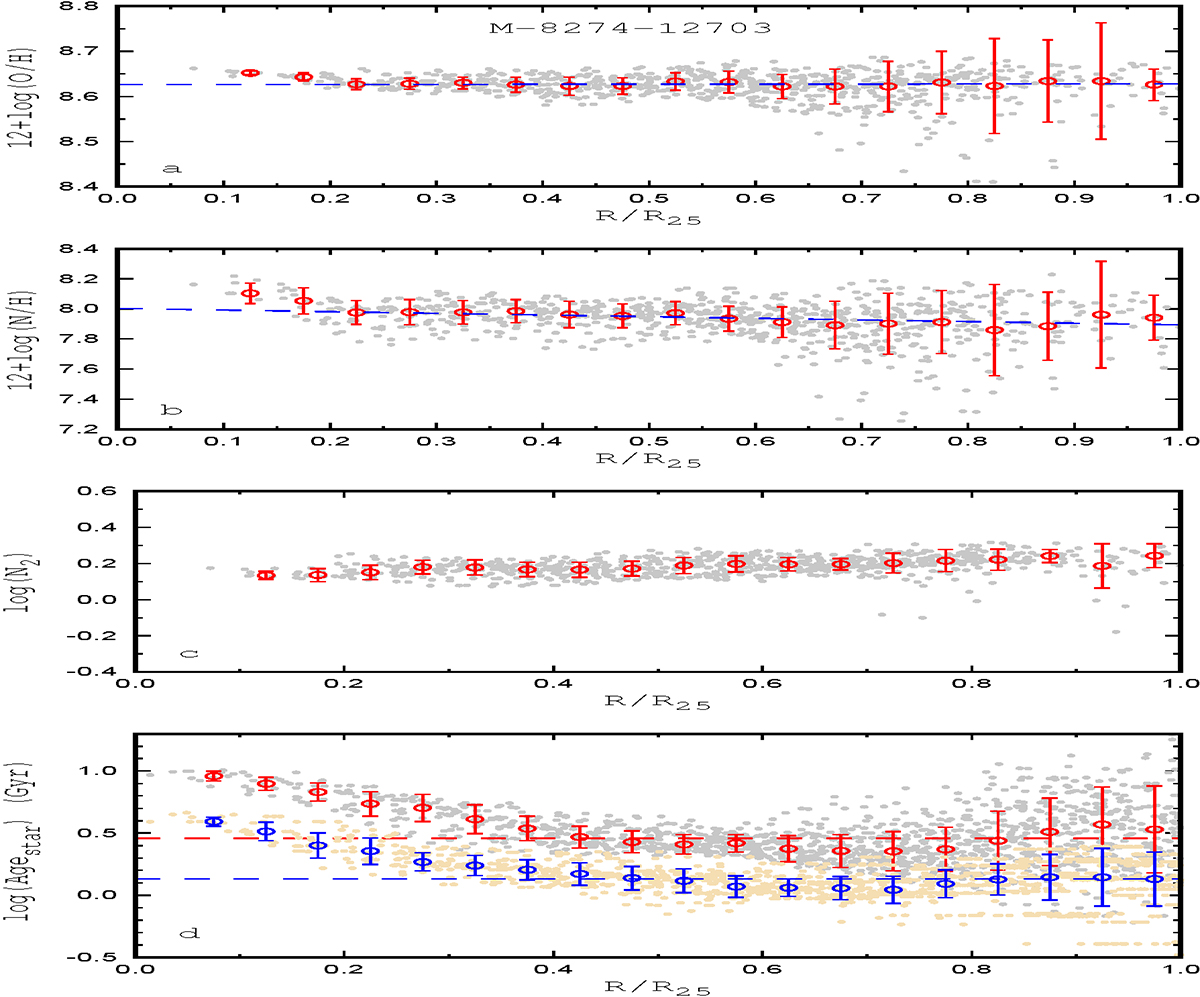
M-8274-12703 is an example of a galaxy with an L-type abundance distribution. Panel a: Radial oxygen abundance distribution. The grey points denote the abundances for the individual spaxels, and the red circles are the median values of the O/H in bins of 0.05 dex in the fractional radius R/R25. The line shows the relation we adopted for the radial abundance distribution. Panel b: Same as panel a, but for the nitrogen abundance. Panel c: Intensity of the emission nitrogen line N2 as a function of radius. The notations are similar to those in panel a. Panel d: Age of the stellar population as a function of radius. The grey points denote the ages of the stellar populations in the individual spaxels estimated from the Dn(4000) index, the red circles mark the median values of the ages in bins, and the dashed red line shows the median value of the ages in all the spaxels within optical radius. The yellow points denote the luminosity-weighed ages of the stellar populations in the individual spaxels taken from Sánchez et al. (2022), the blue circles mark the median values of the ages in bins, and the dashed blue line shows the median value of the ages in all the spaxels within the optical radius.
Current usage metrics show cumulative count of Article Views (full-text article views including HTML views, PDF and ePub downloads, according to the available data) and Abstracts Views on Vision4Press platform.
Data correspond to usage on the plateform after 2015. The current usage metrics is available 48-96 hours after online publication and is updated daily on week days.
Initial download of the metrics may take a while.