Fig. 5.
Download original image
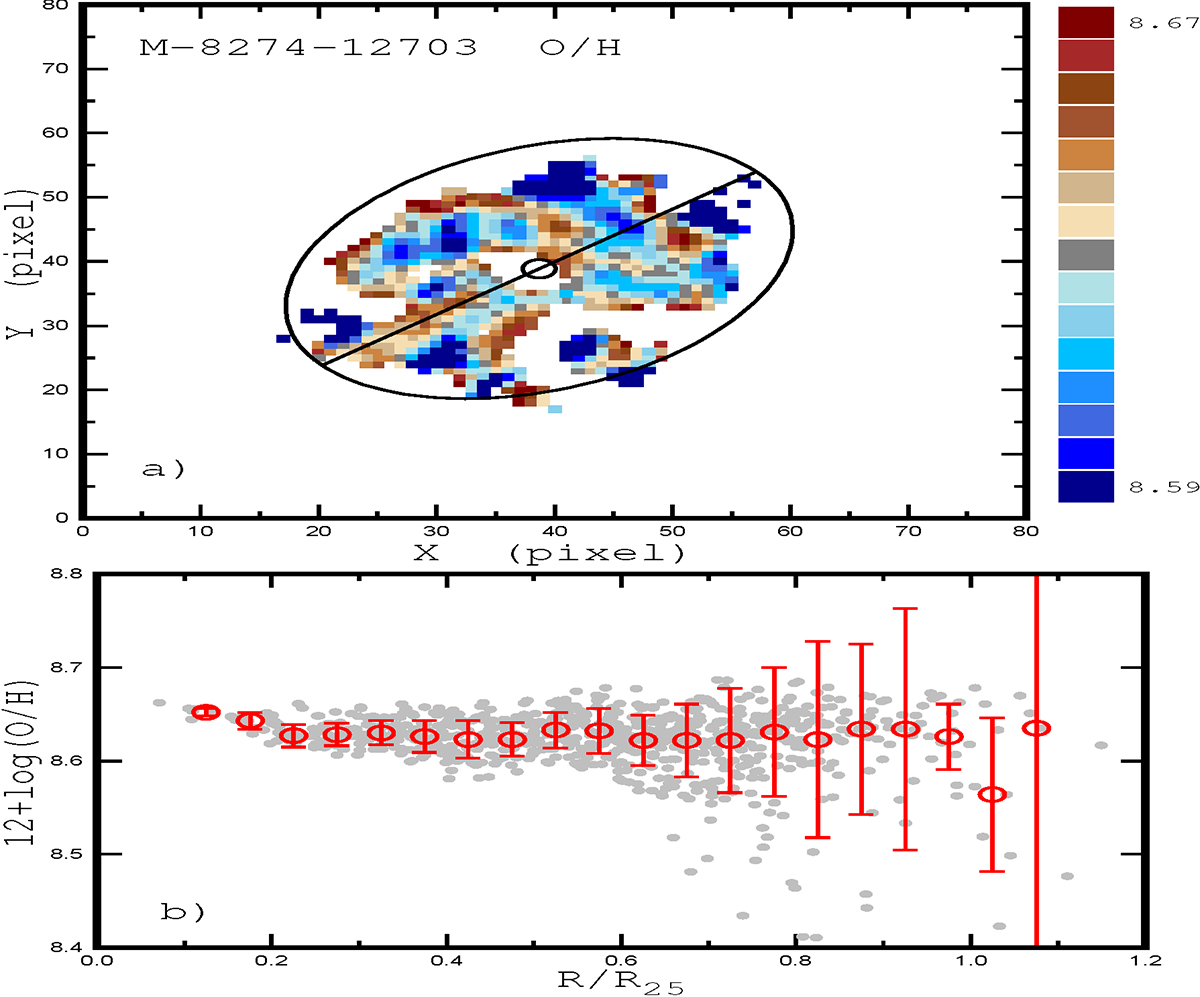
Oxygen abundance in the MaNGA galaxy M-8274-12703. Panel a: Oxygen abundance map. The distribution across the image of the galaxy in sky coordinates (pixels). The oxygen abundance value is colour-coded. The circle shows the kinematic centre of the galaxy, the line indicates the position of the major kinematic axis of the galaxy, and the ellipse is the optical radius. Panel b: Radial oxygen abundance distribution. The grey points denote the abundances for the individual spaxels, the red circles are the median values of the O/H in bins of 0.05 in the fractional radius R/R25, and the bars show the scatter in the O/H about the median value in the bins.
Current usage metrics show cumulative count of Article Views (full-text article views including HTML views, PDF and ePub downloads, according to the available data) and Abstracts Views on Vision4Press platform.
Data correspond to usage on the plateform after 2015. The current usage metrics is available 48-96 hours after online publication and is updated daily on week days.
Initial download of the metrics may take a while.