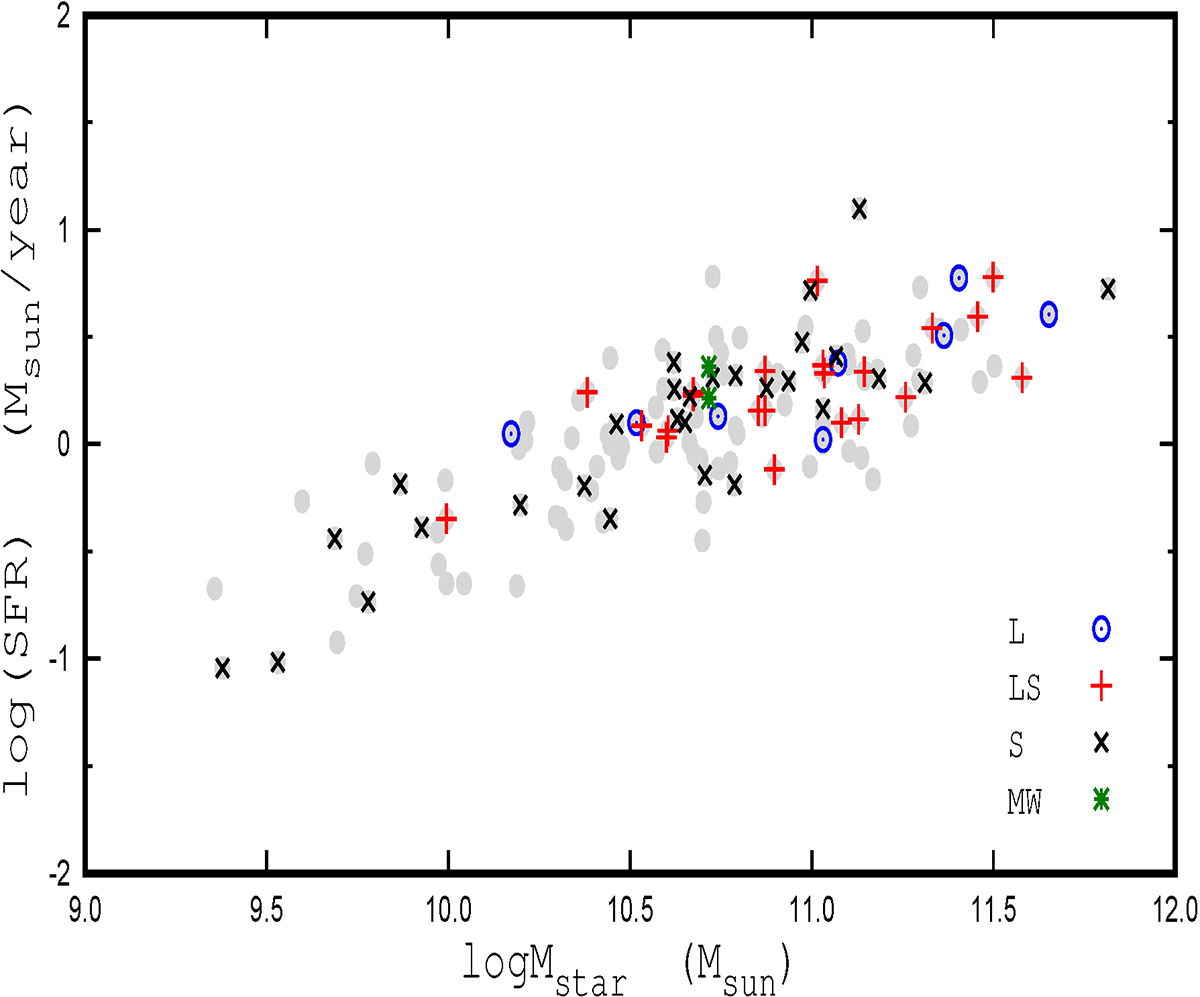
Fig. 18.
Download original image
Star formation rate as a function of stellar mass. The grey points designate the galaxies of the total sample, the blue circles denote galaxies with L gradients, the red plus signs mark galaxies with LS gradients, and the black crosses are galaxies with S gradients. The green asterisks mark the estimates of the SFR in the Milky Way from Licquia & Newman (2015) and from Zari et al. (2023) for a Kroupa initial mass function.
Current usage metrics show cumulative count of Article Views (full-text article views including HTML views, PDF and ePub downloads, according to the available data) and Abstracts Views on Vision4Press platform.
Data correspond to usage on the plateform after 2015. The current usage metrics is available 48-96 hours after online publication and is updated daily on week days.
Initial download of the metrics may take a while.