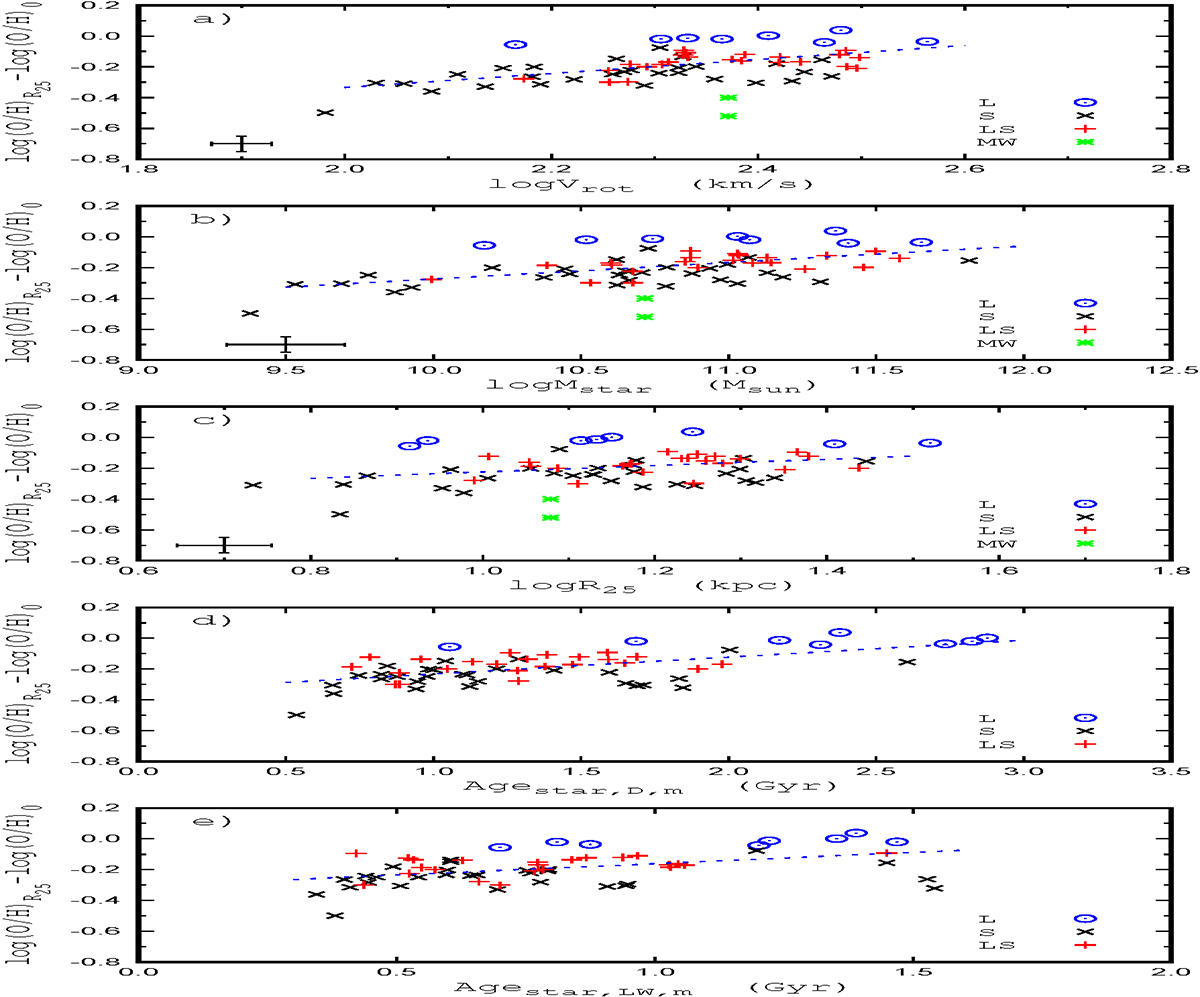
Fig. 17.
Download original image
Difference between the oxygen abundances at the optical radius and at the centre (gradient in dex/R25) as a function of rotation velocity (panel a), stellar mass (panel b), optical radius (panel c), and median value of stellar ages (panels d and e). The blue circles denote galaxies with L gradients, the red plus signs mark galaxies with LS gradients, the black crosses are galaxies with S gradients, and the green asterisks mark two values of the gradient for the Milky Way (see text). The line is the linear fit to all the data points excluding the Milky Way. The error bars are shown in the lower left corner of the panel.
Current usage metrics show cumulative count of Article Views (full-text article views including HTML views, PDF and ePub downloads, according to the available data) and Abstracts Views on Vision4Press platform.
Data correspond to usage on the plateform after 2015. The current usage metrics is available 48-96 hours after online publication and is updated daily on week days.
Initial download of the metrics may take a while.