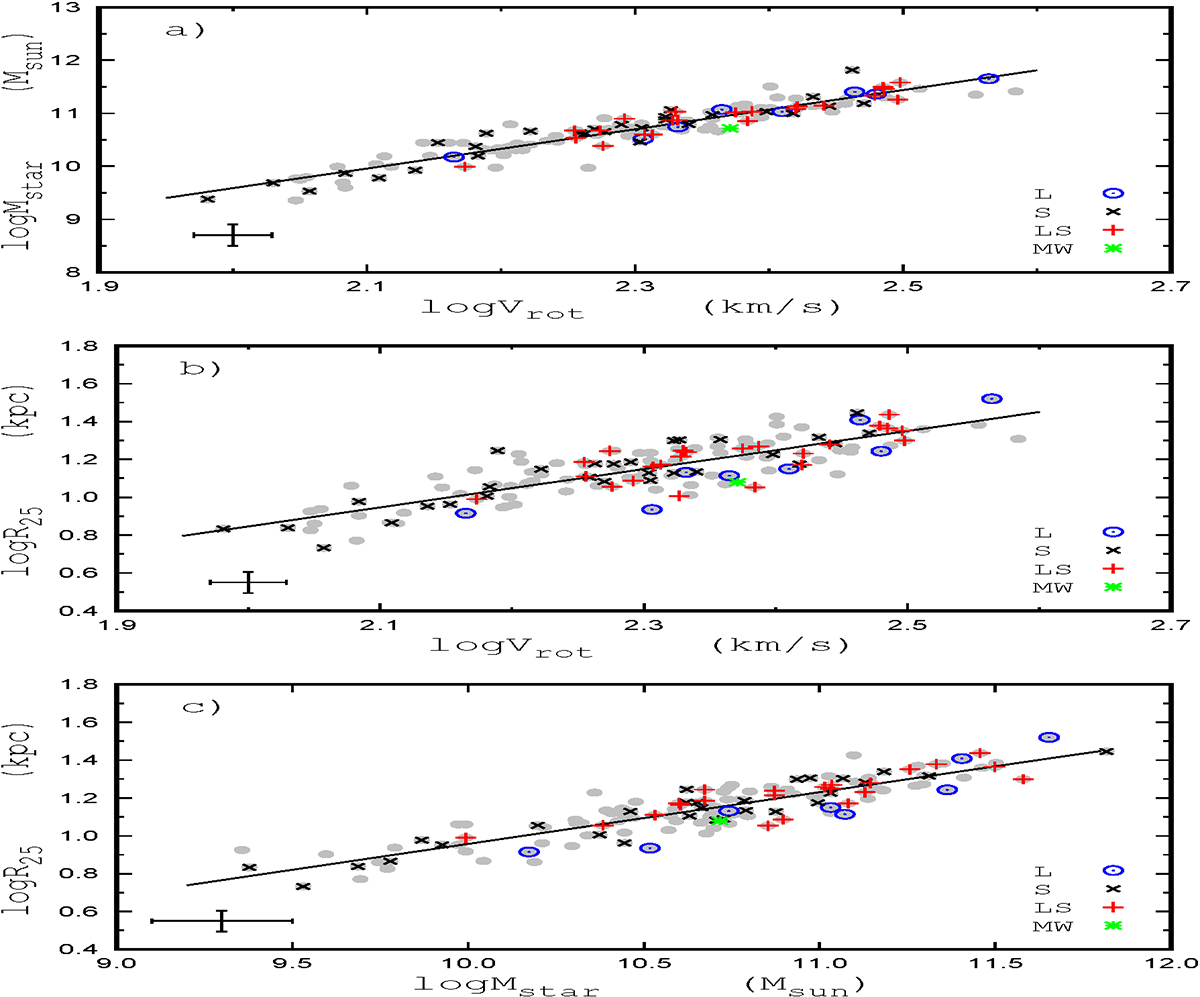
Fig. 15.
Download original image
Relation between the macroscopic galaxy properties. Panel a: Stellar mass as a function of rotation velocity. Panel b: Isophotal radius against rotation velocity. Panel c: Isophotal radius vs. stellar mass. The grey points in each panel designate the galaxies of the total sample, and the line is the linear best fit to these data. The cross shows the error bars. The circles denote the selected galaxies with an L-type radial abundance distribution, the plus signs mark galaxies with an LS-type radial abundance distribution, and crosses are galaxies with an S-type radial abundance distribution. The green asterisk marks the Milky Way.
Current usage metrics show cumulative count of Article Views (full-text article views including HTML views, PDF and ePub downloads, according to the available data) and Abstracts Views on Vision4Press platform.
Data correspond to usage on the plateform after 2015. The current usage metrics is available 48-96 hours after online publication and is updated daily on week days.
Initial download of the metrics may take a while.